Diversity and dynamics within oral bacterial populations
Genome diversity & dynamcis of the oral microbiome
Background
We set out to investigate how genomic diversity changed within oral bacterial populations in healthy mouths (i.e., absent from relatively drastic selective events like antibiotics, hospitalization, etc.). We used the tongue dorsum as a model oral microbial system as it represents a rich oral community on a shedding surface intimately connected at the interface of the human body and exogenous perturbations. This document describes the full computaitonal methods necessary to reproduce the results described in the biorxiv preprint.
Briefly, the sequence data produced here was obtained by recruiting 17 healthy donors who self-sampled their tongue dorsa with a plastic tongue over a two-week window on days 1, 2, 5, 7, and 14. A few volunters missed a day or sampled on an alternate day (e.g., day 3 instead of day 2); all told, we collected 81 samples. For each sample we prepared a metagenomic library with Kapa HyperPrep kits, and the pooled library of all 81 samples was sequenced on 10 NextSeq HO PE150 runs.
Scripts included here that were run on the cluster maintain the requested cluster parameters (e.g., memory and time).
Code background
Raw reads were sequenced in 2017 at the Harvard Bauer Sequencing Core.
Each lane was in a separate directory, e.g., run1 and run2 each
contained 81 fastq pairs. Note that these included substantial human
DNA; for participant privacy we excluded human DNA from the raw data
uploaded to NCBI. For each run, the following script was run:
De-human
#!/bin/bash

mkdir deHumanized

# # cycle through all
fastas=$(ls A* | grep 'A*.fastq')
#fastas="AT15-TD_S58.R1.fastq.gz"  # # re-do specific files

for file in $(echo "$fastas" | sed 's/.R[12].fastq.gz//' | uniq); do

samp=$(echo "$file" | sed 's/-.*$//g')

R1=$(echo "$file.R1.fastq.gz")
R2=$(echo "$file.R2.fastq.gz")

echo "#!/bin/bash
#SBATCH -N 1 #node
#SBATCH -n 1 #one cpu
#SBATCH --mem=8000
#SBATCH -t 0-6:00:00
#SBATCH -p shared
#SBATCH --job-name=deHum-$samp
#SBATCH -o odyssey_deHuman-$samp.out
#SBATCH -e odyssey_deHuman-$samp.err
#SBATCH --mail-type=END
#SBATCH --mail-user=dutter@g.harvard.edu

module load bib

# map vs human database, sam to bam
bowtie2 -x /n/holyscratch01/cavanaugh_lab/dutter/catalyst_metagenome_raw/hg38_bw2/hg38_noalt -1 $R1 -2 $R2 -S $file-mapped_and_unmapped.sam

samtools view -bS $file-mapped_and_unmapped.sam > $file-mapped_and_unmapped.bam

# get unmapped reads (non-human) to new bam
samtools view -b -f 12 -F 256 $file-mapped_and_unmapped.bam > $file-bothEndsUnmapped.bam

# bam back to fasta
bamtools sort -in $file-bothEndsUnmapped.bam -byname | bamtools convert -format fastq -out deHumanized/$file-dehuman.fastq

rm $file*bam $file*sam
" > $file-dehuman.sh

sbatch $file-dehuman.sh && rm $file-dehuman.sh

sleep 20

done
To keep the working directory clear, the original reads were then put
away with mkdir raw_reads && mv *fastq.gz raw_reads
This produced fastq files of all reads not aligning to the human genome. However, the resultant fastq files were interleaved and so we manually split them up with the following script from inside the directory containing each run’s reads:
#!/bin/bash
#SBATCH -N 1 #node
#SBATCH -n 1 #one cpu
#SBATCH --mem=12000
#SBATCH -t 0-2:00:00
#SBATCH -p general
#SBATCH --job-name="splitPE"
#SBATCH -o odyssey_split.out
#SBATCH -e odyssey_split.err
#SBATCH --mail-type=END
#SBATCH --mail-user=dutter@g.harvard.edu

for fasta in $(ls deHumanized/*-dehuman.fastq); do

prefix=$(echo "$fasta" | sed 's/-dehuman.fastq//')

grep -A 3 '^@N.*/1$' $fasta | grep -v '^--$' > $prefix.R1.fastq
grep -A 3 '^@N.*/2$' $fasta | grep -v '^--$' > $prefix.R2.fastq

done
These raw non-human reads were deposited in NCBI at SRA Accessions TO ADD upon manuscript publication.
The files have prefixes in the format IdDay that specify the donor’s
unique id, e.g. AE, and the sample day, e.g. 1. So sample
AB15_QUALITY-PASSED_R1.fastq.gz is the sample obtained from donor AB
on day 15.
QC
Reads were then filtered according to the Minoche et al. 2011 recommendations with illumina-utils:
#!/bin/bash
#SBATCH -N 1 #node
#SBATCH -n 1 #one cpu
#SBATCH --mem=12000
#SBATCH -t 5-06:00:00
#SBATCH -p general
#SBATCH --job-name="iu-filter"
#SBATCH -o odyssey_filter.out
#SBATCH -e odyssey_filter.err
#SBATCH --mail-type=END
#SBATCH --mail-user=dutter@g.harvard.edu

source ~/virtual-envs/anvio-dev-github/bin/activate

mkdir filtered-minoche

# get read names
R1=$(ls A*gz | grep 'R1.fastq' | sed 's/^/, /' | tr -d '\n' | sed 's/^, //')
R2=$(ls A*gz | grep 'R2.fastq' | sed 's/^/, /' | tr -d '\n' | sed 's/^, //')

# make config file
echo "[general]
project_name = catalyst_TD
researcher_email = dutter@g.harvard.edu
input_directory = $PWD
output_directory = $PWD/filtered-minoche

[files]
pair_1 = $R1
pair_2 = $R2

" > filter_config.txt

# filter reads
iu-filter-quality-minoche filter_config.txt
Then we moved back into the top-level directory, prepared a directory
with mkdir filtered-dehuman-reads-all-bzip, and finally concatenated
reads from different runs for the same sample with:
#!/bin/bash
#SBATCH -N 1 #1 nodes of ram
#SBATCH -n 12 # 1 cores from each
#SBATCH --contiguous
#SBATCH --mem=18G #per node
#SBATCH -t 0-12:00:00
#SBATCH -p shared
#SBATCH --job-name='concat'
#SBATCH -o odyssey_concat.out
#SBATCH -e odyssey_concat.err
#SBATCH --mail-type=NONE

for fastq in $(ls run1/deHumanized/*fastq | sed 's,^.*/,,g'); do
cat run*/deHumanized/$fastq > filtered-dehuman-reads-all-bzip/$fastq
done
MAG generation
To construct reference genomes for the bacterial populations dwelling in these populations, we used IDBA-UD to construct Metagenome Assembled Genomes (MAGs).
We co-assembled MAGs by mouth, that is, all metagenomes from one donor (4-7 timepoints) were combined and used to produce a single assembly. This approach was taken to strike a balance between assembling each sample independently, which may miss some low-abundance oral bacteria, and overloading the assembler with the maximum complexity of multiple closely related popualtions from different people’s mouths.
Co-assembly (IDBA-UD)
We used IDBA-UD as we were intially interested in being able to use the same assembler to co-assemble individual donors and also co-assemble the whole dataset. The whole dataset co-assembly did not end up being retained as part of the analysis, but at the time factored into our choice for assembly. At the time of performing these steps in 2017, the best two assemblers that could run on the entire dataset given the 500GB memory accessible were megahit and IDBA-UD (metaSPAdes was attempted but required too much memory). As IDBA-UD outperformed megahit empirically based on size and subsequent MAG quality (data not included), we chose the IDBA-UD assemblies to analyze in detail.
This scripts, and most of the future scripts in the MAG curation
workflow, start with a variable indiv that specifies the individual
being studied. For the rest of the MAG workflow we will use AE as an
example, however, this entire assembly and MAG refinement process was
performed separately for the other 16 donors as well.
So for donor AE, we made a separate directory like AE_coassembly
inside the top-level directory. Here is the script for generating the
co-assembly for donor AE:
#!/bin/bash
#SBATCH -N 1 #1 nodes of ram
#SBATCH -n 12 # 1 cores from each
#SBATCH --contiguous
#SBATCH --mem=80G #per node
#SBATCH -t 5-00:00:00
#SBATCH -p shared
#SBATCH --job-name='concat'
#SBATCH -o odyssey_concat.out
#SBATCH -e odyssey_concat.err
#SBATCH --mail-type=NONE

source ~/virtual-envs/anvio-dev-github/bin/activate

indiv="AE"

cat ../filtered-dehuman-reads-all-bzip/$indiv*QUALITY_PASSED_R1.fastq > raw_$indiv-R1.fastq
cat ../filtered-dehuman-reads-all-bzip/$indiv*QUALITY_PASSED_R2.fastq > raw_$indiv-R2.fastq

fq2fa --merge --filter raw_$indiv-R1.fastq raw_$indiv-R2.fastq interleaved_$indiv.fa


idba_ud -r interleaved_$indiv.fa -o idba_ud-$indiv
Generating contigs database
Contigs were then read into anvi’o
for management during subsequent binning, curation, and annotation of
MAGs. We kept only contigs with a minimum length (--min-len flag) of
2500 nucleotides (nt) as shorter contig lengths may introduce problems
for binning metrics like tetranucleotide frequency and differential
coverage. We generated contig databses with this script:
#!/bin/bash
#SBATCH -N 1 #1 nodes of ram
#SBATCH -n 1 # 1 cores from each
#SBATCH --contiguous
#SBATCH --mem=16G #per node
#SBATCH -t 0-24:00:00
#SBATCH -p shared
#SBATCH --job-name="contigsDB"
#SBATCH -o odyssey_cont.out
#SBATCH -e odyssey_cont.err
#SBATCH --mail-type=END

# need to activate venv directly because node receiving job order doesn't play with bashrc aliases
source ~/virtual-envs/anvio-dev-github/bin/activate

indiv="AE"

# clean up fasta deflines in contig file at the start for smooth downstream
# min-len 2500 = only keep contigs >= 2.5kb since 1kb gives poor tetranuc freq results
anvi-script-reformat-fasta $indiv-idba_ud/contig.fa --simplify-names -o $indiv-contigs.fa

anvi-script-reformat-fasta $indiv-contigs.fa --min-len 2500 -o $indiv-contigs-2500nt.fa

# do the contig gen
anvi-gen-contigs-database -f $indiv-contigs-2500nt.fa -o $indiv-CONTIGS.db
During this step, genes were also called with Prodigal as part of the
anvi-gen-contigs-database program.
And identified single-copy genes with anvi’o’s HMM models:
#!/bin/bash
#SBATCH -N 1 #1 nodes of ram
#SBATCH -n 10 # 10 cores from each
#SBATCH --contiguous
#SBATCH --mem=20G #per node
#SBATCH -t 0-06:00:00
#SBATCH -p shared
#SBATCH --job-name="hmm"
#SBATCH -o odyssey_hmm.out
#SBATCH -e odyssey_hmm.err
#SBATCH --mail-type=END


indiv="AE"

# need to activate venv directly because node receiving job order doesn't play with bashrc aliases
source ~/virtual-envs/anvio-dev-github/bin/activate

# identify single copy genes
anvi-run-hmms -c $indiv-CONTIGS.db --num-threads 10
Functional annotation
To aid in binning, we annotated quickly with only eggNOG at the start:
#!/bin/bash
#SBATCH -N 1 #1 nodes of ram
#SBATCH -n 12 # 12 cores from each
#SBATCH --contiguous
#SBATCH --mem=8G #per node
#SBATCH -t 0-24:00:00
#SBATCH -p shared
#SBATCH --job-name="eggnog"
#SBATCH -o odyssey_anviAnnotate.out
#SBATCH -e odyssey_anviAnnotate.err
#SBATCH --mail-type=END

# 20171016 - assign gene fams by interproscan
indiv="AE"

# need to activate venv directly because node receiving job order doesn't play with bashrc aliases
source ~/virtual-envs/anvio-dev-github/bin/activate

#export sequences
anvi-get-sequences-for-gene-calls -c $indiv-CONTIGS.db -o gene-calls-aa.faa --get-aa-sequences --wrap 0

module load python/2.7.14-fasrc02

/n/helmod/apps/centos7/Core/Anaconda/5.0.1-fasrc02/x/bin/python ../../eggnog/eggnog-mapper/emapper.py -i $batch --output ${batch}_eggnog -m diamond --cpu 12
Subsequent steps (mapping, profiling, and merging() take significant time, so we generally did not parallelize this step as it could just run in the background, and only became relevant once merging was done. However, a few co-assemblies had so many genes that
Mapping short reads to assembled contigs
To obtain the coverage of each of the assembled contigs in each sample
used for co-assembly, we used
bowtie2 to map short reads
from each metagenome onto a reference database corresponding to the
contigs in AE-CONTIGS.db:
#!/bin/bash
#SBATCH -N 1 #1 nodes of ram
#SBATCH -n 1 # 1 cores from each
#SBATCH --contiguous
#SBATCH --mem=2G #per node
#SBATCH -t 0-05:00:00
#SBATCH -p shared
#SBATCH --job-name="bt-mas-AE"
#SBATCH -o odyssey_map_master.out
#SBATCH -e odyssey_map_master.err
#SBATCH --mail-type=END


module load samtools bowtie2 zlib xz

indiv="AE"
outdir="bt_mapped"

# make the db
#bowtie2-build $indiv.fa $indiv

# get list of sample-runs, chop into per sample batches
batches=$(ls ../filtered-dehuman-reads-all-bzip/$indiv*QUALITY_PASSED_R1.fastq.gz | sed "s,^.*/,,g; s/_.*$//" | uniq)

# make dir to stuff samples into
mkdir $outdir

# iterate for each participant
for batch in $batches; do

echo "#!/bin/bash
#SBATCH -N 1 #1 nodes of ram
#SBATCH -n 12 # 12 cores from each
#SBATCH --contiguous
#SBATCH --mem=42G #per node
#SBATCH -t 1-00:00:00
#SBATCH -p shared
#SBATCH --job-name='$batch-bt2'
#SBATCH -o odyssey_map_$batch.out
#SBATCH -e odyssey_map_$batch.err
#SBATCH --mail-type=END

module load samtools bowtie2 zlib xz

batch='$batch'

samples=\$(ls ../../filtered-dehuman-reads-all-bzip/${batch}_*QUALITY_PASSED_R1.fastq.gz | sed 's/_R1.fastq.gz//')

for samp in \$samples; do

sampOut=\$(echo \"\$samp\" | sed \"s/^.*$batch/$outdir\\/$batch/; s/-.*$//\")

R1=\${samp}_R1.fastq.gz
R2=\${samp}_R2.fastq.gz

# map sample set
bowtie2 -x $indiv -1 \$R1 -2 \$R2 --no-unal -S \$sampOut.sam --threads 12

samtools view -S -b \$sampOut.sam > \$sampOut-RAW.bam

samtools sort -@ 12 \$sampOut-RAW.bam > \$sampOut.bam

samtools index \$sampOut.bam

# clean as you go
rm \$sampOut.sam \$sampOut-RAW.bam

done
" > slurm_$batch.sh

sbatch slurm_$batch.sh #&& rm slurm_$batch.sh

sleep 10

done
Profiling
The information (coverage, nucleotide variants) in the BAM files were then imported into anvi’o as PROFILE databases:
#!/bin/bash
#SBATCH -N 1 #1 nodes of ram
#SBATCH -n 1 # 1 cores from each
#SBATCH --contiguous
#SBATCH --mem=1G #per node
#SBATCH -t 0-05:00:00
#SBATCH -p shared
#SBATCH --job-name="prof-m-AE"
#SBATCH -o odyssey_anviProf-master.out
#SBATCH -e odyssey_anviProf-master.err
#SBATCH --mail-type=END


indiv="AE"
assembler="idba_ud"
mapdir="bt_mapped"

mkdir profs_indiv

# get list of samples
batches=$(ls $mapdir | sed 's/_.*$//' | sort | uniq)

for batch in $batches; do


#if ls profs_indiv | grep -q -v "^$batch$"; then
echo "#!/bin/bash
#SBATCH -N 1 #1 nodes of ram
#SBATCH -n 16 # cores from each
#SBATCH --contiguous
#SBATCH --mem=42G #per node
#SBATCH -t 1-24:00:00
#SBATCH -p shared
#SBATCH --job-name=\"prof-$batch\"
#SBATCH -o odyssey_anviProf-$batch.out
#SBATCH -e odyssey_anviProf-$batch.err
#SBATCH --mail-type=END

source ~/virtual-envs/anvio-dev-github/bin/activate
module load samtools zlib xz

bams=\"$mapdir/${batch}_*bam\"

# need to merge the multiple runs into single bam to pass to anvio
samtools merge $mapdir/${batch}.bam \$bams
samtools index $mapdir/${batch}.bam

echo \"Done merging $batch bams, starting profiling...\"
#rm -rf $sample

# profile it
anvi-profile -c $indiv-CONTIGS.db --profile-SCVs -i $mapdir/${batch}.bam --num-threads 16 --write-buffer-size 500 -o profs_
indiv/$batch

echo \"Done profiling $batch\"
" > prof-$batch.sh

sbatch prof-$batch.sh # && rm prof-$batch.sh

sleep 10
#fi

done
These individual per-metagenome PROFILE databases were then merged into a single MERGED database:
#!/bin/bash
#SBATCH -N 1 #1 nodes of ram
#SBATCH -n 1 # 1 cores from each
#SBATCH --contiguous
#SBATCH --mem=120G #per node
#SBATCH -t 3-00:00:00
#SBATCH -p shared
#SBATCH --job-name="merge-AE"
#SBATCH -o odyssey_anviMerge.out
#SBATCH -e odyssey_anviMerge.err
#SBATCH --mail-type=END

# 20170918 merge each individually profiled sample

# need to activate venv directly because node receiving job order doesn't play with bashrc aliases
source ~/virtual-envs/anvio-dev-venv/bin/activate

indiv="AE"

# import function annotation as should be done by now
anvi-import-functions -c $indiv-CONTIGS.db -i interpro-results-formatted.tsv

# merge
anvi-merge profs_indiv/A*/PROFILE.db --enforce-hierarchical-clustering --skip-concoct-binning -o $indiv-MERGED -c $indiv-CONTIGS.db
This step took quite a bit of memory. Significant improvements to anvi’o have been made since by the anvi’o team & community, hopefully if someone is replicating this today the newfound wisdom and grace of anvi’o will make the process more gentle :)
Binning & MAGs
The entire MAG generation process was divided into multiple steps,
detailed below but summarized here to give an idea of how they fit
together. First, CONCOCT did automatic binning of contigs to generate
very rough bins. These bins were then manually refined with
anvi-refine to split bins and identify and remove contaminant contigs.
Then, we manually refined again to do a second pass of refining, just
to be safe. MAGs were then defined from this set as bins with <10%
redundancy and either ≥80% completion or ≥2 Mbp. These MAGs were merged
across co-assemblies (17 sets of MAGs from 17 independent co-assemblies
-> one set of MAGs). Redundant MAGs (duplicate MAGs reconstructed the
same bacteria in different mouths) were then identified, and removed to
identify a final set of 390 non-redundant MAGs.
Binning 1: Rough pass with CONCOCT
At the time of binning these samples, anvi’o had a now-obsolete program
anvi-cluster-with-concoct. In the spirit of transparency, this was the
script that was actually run:
#!/bin/bash
#SBATCH -N 1 #1 nodes of ram
#SBATCH -n 1 # 1 cores from each
#SBATCH --contiguous
#SBATCH --mem=80G #per node
#SBATCH -t 3-00:00:00
#SBATCH -p shared
#SBATCH --job-name="concoct-AE"
#SBATCH -o odyssey_anviMerge.out
#SBATCH -e odyssey_anviMerge.err
#SBATCH --mail-type=END

# 20170918 merge each individually profiled sample

# need to activate venv directly because node receiving job order doesn't play with bashrc aliases
source ~/virtual-envs/anvio-dev-venv/bin/activate

indiv="AE"

# CONCOCT clustering
anvi-cluster-with-concoct -p $indiv-MERGED/PROFILE.db -c $indiv-CONTIGS.db --num-clusters 50 -C CONCOCT
Curently, as of May 2021, the modern anvi’o program would be
anvi-cluster-contigs with the --driver CONCOCT flag.
At this point, we manually refined bins on the basis of tetranucleotide
frequency, differential coverage, and single-nucleotide variant (SNV)
frequencies across all metagenomes corresponding to that co-assembly
(4-7 metagenomes per donor or co-assembly). We did this on a bin-by-bin
process with the anvi-refine feature.
Binning 2: Manual refinement
Having done a first-pass binning (across all donors), we then went through for a second pass. To roughly prune out the obviously poor MAGs of which there was no hope of saving (e.g., MAGs that were very small or very incomplete, regardless of potential contamination), we ran the following script inspired by Tom Delmont & A. Murat Eren’s script for their TARA Oceans analysis:
#!/bin/bash

for SET in `ls | grep "A[A-Z]-idba_ud"`
do
    indiv=$(echo "$SET" | sed 's/-.*$//')
    anvi-rename-bins -c $SET/$indiv-CONTIGS.db \
                     -p $SET/$indiv-MERGED/PROFILE.db \
                     --collection-to-read CONCOCT \
                     --collection-to-write ROUGH \
                     --call-MAGs \
                     --size-for-MAG 2 \
                     --min-completion-for-MAG 70 \
                     --max-redundancy-for-MAG 100 \
                     --prefix ROUGH_$indiv \
                     --report-file $SET/$indiv-rough-bins.txt
done
This process then re-names bins with a prefix ROUGH, which we then
used to identify bins to go back and re-refine. After this second pass,
we then modified the above script to pull out all of the refined MAGs
that met better standards (less than 10% redundant and either ≥ 80%
complete or ≥ 2 million nucleotides in length, as many oral microbes
have approximately 2 Mbp genomes).
#!/bin/bash

for SET in `ls | grep "A[A-Z]-idba_ud"`
do
    indiv=$(echo "$SET" | sed 's/-.*$//')

    # define the bins
    anvi-rename-bins -c $SET/$indiv-CONTIGS.db \
                     -p $SET/$indiv-MERGED/PROFILE.db \
                     --collection-to-read ROUGH \
                     --collection-to-write FINAL \
                     --call-MAGs \
                     --size-for-MAG 2 \
                     --min-completion-for-MAG 80 \
                     --max-redundancy-for-MAG 10 \
                     --prefix FINAL_$indiv \
                     --report-file $SET/$indiv-final-bins.txt

    # summarize each final collection
    anvi-summarize -c $SET/$indiv-CONTIGS.db \
                   -p $SET/$indiv-MERGED/PROFILE.db \
                   -C FINAL \
                   -o $SET/$indiv-SUMMARY

done
Merging co-assemblies
From co-assembly, the possibility exists that the same microbial populations could be binned independently in multiple mouths. However, this issue raises some secondary issues - what exactly is same in this case? 1 SNV? 100 SNVs? Some percent of genes shared/not shared? Average nucleotide identity? Similar abundance trajectories? These definition-related issues aren’t identical, nor are they hierarchical, and they all make different assumptions about microbial ecology and evolution. So we took an approach to identify ‘redundant’ MAGs that accomodates all of these important perspectives on microbial populations, which are applied in these next few steps. These steps are very much inspired by the anvi’o documentation and the Meren lab, with some minor tweaks for oral microbes.
Identifying and removing redundant MAGs
First we collected all of the MAGs and placed them into a directory:
#!/bin/bash
#SBATCH -N 1 #1 nodes of ram
#SBATCH -n 1 # cores from each
#SBATCH --contiguous
#SBATCH --mem=8G #per node
#SBATCH -t 0-08:00:00
#SBATCH -p shared
#SBATCH --job-name="mergeRedundant"
#SBATCH -o odyssey_mergeRedundant.out
#SBATCH -e odyssey_mergeRedundant.err
#SBATCH --mail-type=END


mkdir REDUNDANT-MAGs
mkdir REDUNDANT-MAGs/indiv_MAGs

source ~/virtual-envs/anvio-dev-venv/bin/activate

for SET in `ls | grep "A[A-Z]-idba_ud"`
do
    indiv=$(echo "$SET" | sed 's/-.*$//')

    MAGs=`anvi-script-get-collection-info -c $SET/$indiv-CONTIGS.db -p $SET/$indiv-MERGED/PROFILE.db -C
 FINAL | grep MAG | awk '{print $1}'`

    for MAG in $MAGs; do
        # reformat fasta and put into redundant MAGs
        anvi-script-reformat-fasta $SET/$indiv-SUMMARY/bin_by_bin/$MAG/$MAG-contigs.fa --simplify-names
 --prefix $MAG -o REDUNDANT-MAGs/indiv_MAGs/$MAG.fa
    done

done

cat REDUNDANT-MAGs/indiv_MAGs/*fa > REDUNDANT-MAGs/indiv_MAGs/REDUNDANT-MAGs.fa
NB: from this step forward, the subsequent analyses are applied singly to all MAGs generated from any mouth; no longer are processes done by volunteer.
And then we ran the steps above (generating CONTIGS and merged
PROFILE databases). Note that at this point, since these are merged,
we mapped ALL metagenomes, i.e., 81 metagenomes from 17 participants,
onto the combined CONTIGS database of 409 MAGs from all co-assemblies.
This metagenomic read recruitment is thus competitive, with each read
being mapped against all contigs from all MAGs before being assigned to
to the contig locus to which it maps best.
Correlation
MAGs were correlated to determine which MAGs were tightly correlated in coverage (indicative of being potentially duplicate MAGs).
#!/usr/bin/env Rscript

library(reshape2)

options(max.print=1000000000)

mean_coverage <- t(read.delim(file="REDUNDANT-MAGs-SUMMARY/bins_across_samples/mean_coverage.txt",
                              header = TRUE,
                              stringsAsFactors = FALSE,check.names = F, row.names = 1))

correlations <- melt(data = cor(mean_coverage, use="complete.obs", method="pearson"))

names(correlations) <- c('MAG_1', 'MAG_2', 'correlation')

#write.table(correlations, "REDUNDANT-MAGs-PEARSON.txt", sep="\t", quote=FALSE,  col.names=NA)
Taxonomy
We also ran GTDB-Tk for taxonomy:
#!/bin/bash
#SBATCH -N 1 #1 nodes of ram
#SBATCH -n 8 # 12 cores from each
#SBATCH --contiguous
#SBATCH --mem=180G #per node
#SBATCH -t 0-06:00:00
#SBATCH -p shared
#SBATCH --job-name="gtdbtk"
#SBATCH -o odyssey_gtdbtk.out
#SBATCH -e odyssey_gtdbtk.err
#SBATCH --mail-type=END

source ~/virtual-envs/anvio-dev-github/bin/activate
export GTDBTK_DATA_PATH=$PWD/release95

gtdbtk classify --align_dir gtdbtk/align --genome_dir gtdbtk/genomes --out_dir gtdbtk/classify --extension fa --cpus 8
ANI
Taxonomy was then used when calculating average nucleotide identity (ANI) between read pairs so that ANI was only compared intra-phyla for efficiency and accuracy:
#!/bin/bash

grep "MAG" REDUNDANT-MAGs-gtdbtk.txt | awk '{print $1 "\t" $4}' | sed 's/k__.*;c__//; s/;.*$//; s/k__//' > REDUNDANT-MAGs-AFFILIATIONS.txt

awk '{print $1"\t"$3}' REDUNDANT-MAGs-SUMMARY/bins_summary.txt > REDUNDANT-MAGs-LENGTH.txt

B="REDUNDANT-MAGs-SUMMARY/bin_by_bin"

echo -e "MAG\tlength\tcompletion\tredundancy" > REDUNDANT-MAGs-STATS.txt
for MAG in $(ls --color=none $B | grep MAG); do
  length=`cat $B/$MAG/$MAG-total_length.txt`
  completion=`cat $B/$MAG/$MAG-percent_completion.txt`
  redundancy=`cat $B/$MAG/$MAG-percent_redundancy.txt`
  echo -e "$MAG\t$length\t$completion\t$redundancy"
done >> REDUNDANT-MAGs-STATS.txt

#!/bin/bash
#SBATCH -N 1 #1 nodes of ram
#SBATCH -n 32 # 12 cores from each
#SBATCH --contiguous
#SBATCH --mem=120G #per node
#SBATCH -t 1-12:00:00
#SBATCH -p shared
#SBATCH --job-name="ANI"
#SBATCH -o odyssey_anviANI.out
#SBATCH -e odyssey_anviANI.err
#SBATCH --mail-type=END

# need to activate venv directly because node receiving job order doesn't play with bashrc aliases
source ~/virtual-envs/anvio-dev-venv/bin/activate

module load MUMmer

anvi-compute-ani -i REDUNDANT-MAGs-internal-genomes-table.txt --method ANIm -o REDUNDANT-MAGs-ANI -T 32
Defining redundant MAGs
With this collected information (coverage correlation, ANI, taxonomy), we proceeded to define and remove redundant MAGs (retaining the higher-quality MAG). To tweak this, we used Alon Shaiber’s redundancy script, modified slightly:
#!/usr/bin/env python

import argparse
import pandas as pd

__author__ = "Alon Shaiber"
__copyright__ = "Copyright 2017, The anvio Project"
__status__ = "Development"


parser = argparse.ArgumentParser(description='A short helper script to generate a table that is ready for redundancy analysis (the next step is export-non-redundant-genomes.py)')
group0 = parser.add_argument_group('ESSENTIAL INPUTS', "You must supply the following TAB-delimited files.")
group1 = parser.add_argument_group('ESSENTIAL OUTPUT', "You must supply a name for the output file.")

group0.add_argument('-m', '--metadata', metavar='PATH', default=None, dest='metadata', help='A TAB-delimited file with metadata regarding each genome. It has to contain the following columns: name, length, completion, redundancy, domain.')
group0.add_argument('-C', '--correlation', metavar='PATH', default=None, dest='correlation', help='A TAB-delimited file containing the correlation information between the occurance of pairs of genomes. It must contain the following columns: key, item_1, item_2, correlation.')
group0.add_argument('-a', '--ani', metavar='PATH', default=None, dest='ani', help='A TAB-delimited matrix with alignment percentages pairs of genomes (for example the output from anvi-compute-ani)')
group0.add_argument('-l', '--ani_length', metavar='PATH', default=None, dest='ani_len', help='A TAB-demlimited matrix of alignment lengths, e.g. reported by anvi-compute-ani')
group1.add_argument('-t', '--taxonomy', metavar='PATH', default=None, dest='taxonomy', help='A TAB-delimited file containing the taxonomic affiliation for each MAG')
group1.add_argument('-o','--output', metavar='PATH', default='FINAL-MAGs-LIST.txt', help='Name of output file for the data table')

group1.add_argument('-A','--minANI', metavar='DECIMAL', default=0.98, help='Minimum percent ANI to be considered redundant [DEFAULT 0.98]')
group1.add_argument('-L','--minAlign', metavar='DECIMAL', default=0.75, help='Minimum fraction of the smaller MAG\'s length for considering the alignment threshold of --minANI [DEFAULT 0.75]')
group1.add_argument('-R','--minCor', metavar='DECIMAL', default=0.85, help='Minimum correlation coefficient to be considered redundant [DEFAULT 0.85]')

args = parser.parse_args()

minANI = args.minANI
minAlign = args.minAlign
minCor = args.minCor

out_filepath = args.output

metadata = pd.read_csv(args.metadata, sep='\t')

if args.taxonomy:
    taxonomy = pd.read_csv(args.taxonomy, sep='\t', header=None)
    taxonomy.columns = ['MAG', 'tax']

correlation = pd.read_csv(args.correlation, sep='\t')
correlation.columns.values[0] = 'key'

ani = pd.read_csv(args.ani, sep='\t')
ani = pd.melt(ani, id_vars=['key'])
ani.columns = ['MAG_1', 'MAG_2', 'ANI']

ani_len = pd.read_csv(args.ani_len, sep='\t')

redundant_MAGs = metadata['MAG'].unique()

redundant_groups = []
for MAG in redundant_MAGs:
    # find MAGs > minANI
    high_ANI = list(ani.loc[(ani['MAG_1'] == MAG)  # for this mag
                       & (ani['ANI'] >= minANI)  # if ANI is high enough
                       & (ani['MAG_2'] != MAG),  # but not this mag itself
                       'MAG_2'])  # report the other MAG

    long_ANI = [x for x in high_ANI if  # if alignment fraction is >= minAlign of the smaller genome
                float(ani_len.loc[ani_len['key'] == MAG, x] /
                metadata.loc[(metadata['MAG'] == x) | (metadata['MAG'] == MAG), 'length'].min()) >= minAlign]

    correlated = [x for x in long_ANI if
                  float(correlation.loc[(correlation['MAG_1'] == MAG) & (correlation['MAG_2'] == x), 'correlation']) >= minCor]

    if correlated:
        correlated.append(MAG)
        redundant_groups.append(correlated)

MAGs_to_keep = redundant_MAGs

for grp in redundant_groups:
    best_MAG = metadata.loc[(metadata['MAG'].isin(grp)) &
                       (metadata['completion'] == metadata.loc[metadata['MAG'].isin(grp),'completion'].max()),'MAG'].item()
    mags_to_replace = [x for x in grp if x is not best_MAG]

    MAGs_to_keep = [best_MAG if x in mags_to_replace else x for x in MAGs_to_keep]

print(str(len(redundant_MAGs)) + " MAGs came in")
print(str(len(set(MAGs_to_keep))) + " MAGs made it out")

print("Saving output to: " + out_filepath)
with open(out_filepath, 'w') as f:
    [f.write(x + '\n') for x in sorted(set(MAGs_to_keep))]
We applied this script to identify a list of non-redundant MAGs with the following command:
./anvi-define-redundant-MAG-groups.py \
    -m REDUNDANT-MAGs-STATS.txt \  # metadata of MAGs so the better MAG can be retained
    -C REDUNDANT-MAGs-PEARSON.txt \  # correlations
    -a REDUNDANT-MAGs-ANI/ANIm_percentage_identity.txt \  # ANI percent identity
    -l REDUNDANT-MAGs-ANI/ANIm_alignment_lengths.txt \   # ANI alignment lengths
    -o NON-REDUNDANT-MAGs-LIST.txt
Dropping redundant MAGs
Having identified the non-redundant set of MAGs, we concatenated their
corresponding fastas into a single fasta with
cat indiv_MAGs/*fa > $indiv.fa, which then was used to create a new
anvi’o contigs database NON-REDUNDANT-MAGs-CONIGS.db using the same
script as before except for setting the indiv variable to
NON-REDUNDANT-MAGs. This merged fasta and corresponding contigs db was
then used with the exact workflow as before to recruit reads from all
samples, profile the results, and merge the profiles into
NON-REDUNDANT-MAGs-MERGED. The association between contigs and MAGs
was then reconstructed from the contig IDs with the following lines:
grep '>' NON-REDUNDANT-MAGs.fa | awk '{print $0 "\t" $0}' | sed 's/>//g; s/_[0-9]*$//' > NON-REDUNDANT-MAGs-COLLEC
TION.txt

anvi-import-collection NON-REDUNDANT-MAGs-COLLECTION.txt -c NON-REDUNDANT-MAGs-CONTIGS.db -p NON-REDUNDANT-MAGs-MER
GED/PROFILE.db -C NON_REDUNDANT_MAGs --contigs-mode

anvi-summarize -c NON-REDUNDANT-MAGs-CONTIGS.db -p NON-REDUNDANT-MAGs-MERGED/PROFILE.db -C NON_REDUNDANT_MAGs -o NO
N-REDUNDANT-MAGs-SUMMARY
Finishing touches
With this final set of MAGs, we finalized the annotation and taxonomy.
Taxonomic assignment (GTDB)
We used GTDB-Tk by Parks et al., 2015
#!/bin/bash
#SBATCH -N 1 #1 nodes of ram
#SBATCH -n 32 # 12 cores from each
#SBATCH --contiguous
#SBATCH --mem=64G #per node
#SBATCH -t 1-00:00:00
#SBATCH -p shared
#SBATCH --job-name="gtdbtk-MAGs"
#SBATCH -o odyssey_gtdbtk.out
#SBATCH -e odyssey_gtdbtk.err
#SBATCH --mail-type=END

# need to activate venv directly because node receiving job order doesn't play with bashrc aliases
source ~/virtual-envs/gtdbtk/bin/activate

prefix="REDUNDANT-MAGs"

#cd indiv_MAGs

gtdbtk tree indiv_MAGs -x .fa -t 32 `pwd`/$prefix-gtdbtk-TREE

gtdbtk tree_qa `pwd`/$prefix-gtdbtk-TREE -f $prefix-gtdbtk.txt
Adding EggNOG annotations
EggNOG annotations were run as above, also InterProScan was run as described in http://dutter.github.io/projects/oral_metapan#functional-annotation
DESMAN to identify subpopulations
For these final non-redundant MAGs, we used
DESMAN to identify
‘haplotypes,’ or putatively co-inherited sets of genes inherited
together. Briefly, the method works by identifying SNVs for informative
positions from bacterial core genes (which we have from above, during
the anvi-profile and anvi-run-hmms steps), and using the frequencies
of each nucleotide variant to estimate which occur on the same
chromosome. We use the results of this approach as an operational
definition for sub-population: temporally distinct genome types within
(=sub-) a set of closely-related genomes represented by a high quality
MAG (= population).
Exporting SNVs from anvi’o
We used the set of 71 bacterial core genes identified by anvi’o. This
script loops through all MAGs in the NON-REDUNDANT set, and identifies
each mag’s gene callers for those HMM-identified core genes, and
thenanvi-gen-variability-profile outputs the SNV frequencies for
variant sites in each gene. Note that the
--min-coverage-in-each-sample flag was set to 0, as DESMAN has its
own method for filtering out informative vs. uninformative SNV sites, so
we pass it all possible variant frequencies for it to do that.
#!/bin/bash
#SBATCH -N 1 #1 nodes of ram
#SBATCH -n 1 # 12 cores from each
#SBATCH --contiguous
#SBATCH --mem=12G #per node
#SBATCH -t 0-3:00:00
#SBATCH -p shared
#SBATCH --array=0-29%30
#SBATCH --job-name="varDes"
#SBATCH -o odyssey_var_for_des.out
#SBATCH -e odyssey_var_for_des.err
#SBATCH --mail-type=NONE

# set this up first
# split -l 13 -d -a 4 NON-REDUNDANT-MAGs-LIST.txt NON-REDUNDANT-MAGs-LIST.txt-
# mkdir mag_bacteria71_genes

prefix=NON-REDUNDANT-MAGs

taskNum=$(printf %04d $SLURM_ARRAY_TASK_ID)  # format slurm task id to be padded with 0s like split

for MAG in $(cat NON-REDUNDANT-MAGs-LIST.txt-$taskNum); do

anvi-get-sequences-for-hmm-hits -c $prefix-CONTIGS.db -p $prefix-MERGED/PROFILE.db -C NON_REDUNDANT_MAGs -b $MAG --hmm-sources Bacteria_71 -o mag_bacteria71_genes/$MAG-genes.fna

gene_calls=$(grep '>' mag_bacteria71_genes/$MAG-genes.fna | sed 's/^.*gene_callers_id:\([0-9]*\).*$/\1/' | tr '\n' ',' | sed 's/,$//')

# --quince-mode essential for DESMAN later
anvi-gen-variability-profile -c $prefix-CONTIGS.db -p $prefix-MERGED/PROFILE.db --gene-caller-ids $gene_calls --engine NT --min-coverage-in-each-sample 0 --quince-mode -o mag_bacteria71_genes/$MAG-Bacteria_71-SNVs.txt

done
However, DESMAN requires different input formatting than anvi’o outputs (see DESMAN github), which was generated with the following short R code:
MAGs <- list.files("catalyst_idba/mag_bacteria71_genes/", pattern=".txt", full.names = F)

for (MAG in gsub("-Bacteria.*$", "", MAGs)){
  #MAG <- "FINAL_AI_MAG_00002"

  vars <- read.csv(paste0("catalyst_idba/mag_bacteria71_genes/", MAG, "-Bacteria_71-SNVs.txt"), sep="\t", header=T)

  vars <- melt(vars, id.vars = c('corresponding_gene_call','sample_id','pos'), measure.vars = c("A","T","C","G"))
  vars$sampleNuc <- paste(vars$sample_id, vars$variable, sep = "-")
  vars <- dcast(vars, corresponding_gene_call + pos ~ sampleNuc, value.var = 'value', fill=0)

  colnames(vars)[1:2] <- c('Contig', 'Position')

  write.table(vars, paste0("catalyst_idba/mag_bacteria71_genes/", MAG, "-Bacteria_71-SNVs.csv"), quote = F, col.names = T, row.names = F, sep = ",")
}
DESMAN variant sites
This formatted input is then passed to DESMAN for the tool to apply its variant filtration method and identify informative positions:
# inside folder DESMAN
for stub in $(ls catalyst_idba/mag_bacteria71_genes/*csv | sed 's/.csv//'); do
desman/Variant_Filter.py $stub.csv -o $stub-DESMAN -p
done
The selected variants were then used for the next step.
DESMAN
DESMAN requires an estimation of the expected number of haplotypes/strains to exist within the population. This is clearly difficult to know for certain prior, so the recommended approach is to run desman for several different G’s (number of strains to deconvolve into) to generate decompositions for all reasonable/feasible numbers. From these, the posterior deviances can then be used to estimate the tradeoff point between better fit to the observed frequencies vs. overfitting.
We ran these on the cluster like so (note that the ls ... split line
was run first to set up numerically incremented batches for the slurm
array):
#!/bin/bash
#SBATCH -N 1 #1 nodes of ram
#SBATCH -n 10 # 10 cores from each
#SBATCH --contiguous
#SBATCH --mem=124G #per node
#SBATCH -t 0-32:00:00
#SBATCH -p shared
#SBATCH --array=0-363%364
#SBATCH --job-name="desman"
#SBATCH -o odyssey_desman_%a.out
#SBATCH -e odyssey_desman_%a.err
#SBATCH --mail-type=NONE

# set this up first
# ls mag_bacteria71_genes/*SNVs.csv | sed 's/.csv//' | split -l 1 -d -a 4 - mag_bacteria71_genes/desBatches/batch-

desmanDir=mag_bacteria71_genes

taskNum=$(printf %04d $SLURM_ARRAY_TASK_ID)  # format slurm task id to be padded with 0s like split
MAG=$(cat $desmanDir/desBatches/batch-$taskNum)

source ~/virtual-envs/anvio-dev-github/bin/activate

for strains in 1 2 3 4 5 6 7 8 10 12; do
  echo $strains  # so we know what ID we're on

  (desman $MAG-DESMANsel_var.csv -g $strains -i 500 -e $MAG-DESMANtran_df.csv -o $MAG-DESMAN-FINAL_${strains}_0)&
  # the ()& means run and detatch as subprocesses since single threads, then wait for all to finish
done; wait
Note that only 364 MAGs entered the deconvolution step; 26 MAGs have fallen out by this point due to a lack of usable SNVs.
In reality, this DESMAN step in will crash for many due to memory or
time requirements, since this is attempting to run 364 jobs that each
run 10 tasks in parallel of varying complexity, so this script ended up
being run iteratively with varying #SBATCH --array IDs. That is, we
first ran it on all 364x10, caught the array ID’s for jobs that timed
out or crashed from memory, updated the memory/time requests and set the
--array to use only those failed runs, and repeated this until all
were done.
Identifying optimum DESMAN strains
We then concatenated the fit results from all strain numbers per MAG like so:
for stub in $(ls *-SNVs.csv | sed 's/.csv//'); do cat $stub*/fit.txt | cut -d"," -f2- > $stub-DESMAN-DEV.csv; done
Then heuristic to estimate optimal number of haplotypes to use: -f is
minimum fraction (at least 1%), -d is %step in posterior deviance,
-m is max errors
for stub in $(ls *-SNVs.csv | sed 's/.csv//'); do resolvenhap.py -d 0.4 -m 2 -f 0.01 $stub-DESMAN-FINAL; done >> desmanStrainOptima.csv
Then in R, we plotted the posterior deviance for all G’s while highlighting the predicted optimum G to make sure the heuristic produced the expected, or at least reasonable, results:
library(ggplot2)

MAG <- "FINAL_AI_MAG_00008"

desStrains <- read.csv('catalyst_idba/mag_bacteria71_genes/desmanStrainOptima.csv', col.names = c('nHap','nGoodHap','index','avg_err','base_pred_file'))
numStrains <- desStrains$nHap[grep(MAG,desStrains$base_pred_file)]

desmanStats <- read.csv(paste0("catalyst_idba/mag_bacteria71_genes/", MAG, "-Bacteria_71-SNVs-DESMAN-DEV.csv"), header=F, col.names = c("H","G","LP","Dev"))
desmanStats$Gfactor <- factor(desmanStats$G, sort(desmanStats$G))

desColors <- setNames(rep('black', length(desmanStats$G)),desmanStats$G)
desColors[as.character(numStrains)] <- 'red'

ggplot(desmanStats, aes(x = G, y = Dev)) + geom_smooth()+ geom_point(aes(color=Gfactor)) + theme_bw() +
    ylab("Mean posterior deviance") + xlab("Number of strains - G") +
    scale_color_manual(values = desColors, guide=F) +
    theme(axis.text=element_text(size=12),axis.title=element_text(size=14,face="bold"), panel.grid = element_blank(), panel.border = element_blank(),
          axis.line = element_line())

## `geom_smooth()` using method = 'loess' and formula 'y ~ x'
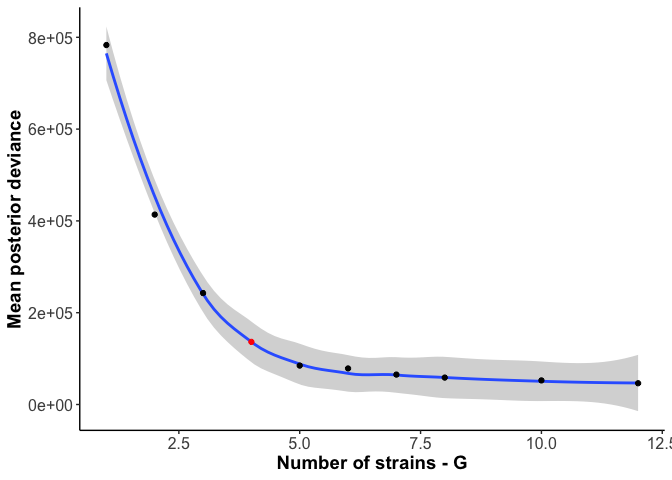
And for the example here, FINAL_AI_MAG_00008, the chosen number of
haplotypes (4) is indeed around the knee in the deviance curve, so 4
haplotypes does appear optimal.
Analyses and plots
The majority of the remaining analyses and figures were generated with R, documented with the code below
Libraries and basic constants
library(ggplot2)
library(ggridges)
library(reshape2)
library(plyr)
library(dplyr)

## Warning: package 'dplyr' was built under R version 3.6.2

library(gtools)
library(grid)
library(scales)
library(vegan)
library(beyonce)
library(tidyr)
library(RColorBrewer)

theme_basic <- theme_classic() + theme(axis.ticks.x = element_blank(), axis.text = element_text(color = 'black'), plot.title = element_text(hjust = 0.5),
                                       plot.subtitle = element_text(hjust = 0.5), strip.background = element_rect(fill = '#dcdcdc', colour = NA))
theme_basic_horizontal <- theme_basic + theme(axis.text.x = element_text(color = 'black', angle = 90, hjust = 1, vjust = 0.5))

dans_colors <- c("#FF0000","#F6A300","#0068CC","#6600AA","#AC0088","#AA33FF","#00FFFF","#00CC00","#006611","#00AC99",
                 "#AC6844","#FFFF00",
                 "#991100","#ACAC11","#a0f0aa","#FF00FF","#FF8611","#B9F6F6","#001166","#AC9A00","#994141","#ff1169",
                 "#0AF622","#119924","#Ac3311","#004A9A","#AcAc99","turquoise","tomato","sienna1","rosybrown",
                 "peachpuff","olivedrab3","mistyrose1","mediumorchid","indianred2","#114914","#660011","ivory3","deeppink","#331111")

cogValues <- c(
"K"="K: Transcription",
"L"="L: Replic., Recom., Repair",
"D"="D: Cell division/chrom. partition",
"E"="E: AA trans./metabol.",
"J"="J: Translation, ribo. struct.",
"G"="G: Carbohydrate trans./metabol.",
"C"="C: Energy production/metabol.",
"V"="V: Defense",
"P"="P: Inorg. ion trans./metabol.",
"H"="H: Coenzyme trans./metabol.",
"F"="F: Nucl. trans/metabol.",
"U"="U: Intracell. traf., sec., trans.",
"T"="T: Signal transduction",
"Q"="Q: Sec. metabolites",
"O"="O: Post-transl. modification",
"I"="I: Lipid trans./metabol.",
"M"="M: Cell envelope/wall",
"N"="N: Cell motility",
"S"="S: Function Unknown"
)
Functions used
makegtdbtktaxMat <- function(gtdbtkPath="catalyst_idba/gtdbtk/classify/gtdbtk.bac120.summary.tsv", shortform=T){
    gtdbtk <- read.csv(gtdbtkPath, header = T, sep = "\t")

    colnames(gtdbtk)[1] <- c("MAG")

    gtdbtk <- gtdbtk[-nrow(gtdbtk),]  # drop row of dashes
    gtdbtk$participant <- gsub("^.*_(A[A-Z])_.*$","\\1", as.character(gtdbtk$MAG))

    # clean up c/g/etc prefixes in naming
    gtdbtk$classification <- gsub("[a-z]__","",as.character(gtdbtk$classification))

    taxMat <- rbind.fill.matrix(lapply(strsplit(as.character(gtdbtk$classification), ";"), function(x) matrix(x, ncol = length(x), byrow=T)))
    taxMat[is.na(taxMat)] <- 'Unidentified'
    colnames(taxMat) <- c("Domain","Phylum","Class","Order","Family","Genus","Species")
    gtdbtk <- cbind(gtdbtk,as.data.frame(taxMat))

    if(shortform){
      gtdbtk <- gtdbtk[,c("MAG","participant",c("Domain","Phylum","Class","Order","Family","Genus","Species"),"classification_method","note","warnings")]
    }

    return(gtdbtk)
}

correlateByBin <- function(infoDF, covDF, binDF, bin, minMedCov=1, maxCorThresh = 1, minCorThresh=-1, minCountThresh=1) {
    covDF <- covDF[covDF$key %in% infoDF[infoDF$bin == bin,"gene_callers_id"],]

    indivs <- unique(gsub("[0-9]*$","",colnames(covDF)[2:ncol(covDF)]))

    corDF <- data.frame(gene=rep(covDF$key, length(indivs)), Individual=sort(rep(indivs,nrow(covDF))), bin=bin, p.value=NA, correlation=NA)

    for (indiv in indivs) {
      binTrace <- as.numeric(binDF[binDF$bins == bin, grep(indiv, colnames(binDF))])

      if (median(binTrace) >= minMedCov){
        for (gene in unique(as.character(covDF$key))){
          geneTrace <- as.numeric(covDF[covDF$key == gene, grep(indiv, colnames(covDF))])

          geneCor <- cor.test(geneTrace, binTrace, method = 'spearman', exact = F)

          corDF[(corDF$gene == gene) & (corDF$Individual == indiv), c("p.value","correlation")] <- c(geneCor$p.value, geneCor$estimate)
        }
      } else {
        print(paste0(indiv, " had <", minMedCov, "X coverage (median), so skipping. Bye!"))
        corDF[corDF$Individual == indiv, "bin"] <- NA
      }
    }
    corDF <- corDF[!is.na(corDF$bin),]

    if (nrow(corDF) > 0){
      if (minCountThresh == 'all') {
        minCountThresh <- length(unique(as.character(corDF$Individual)))
      }

      corDFrecast <- dcast(corDF, gene ~ Individual, value.var="correlation")

      corDF <- corDF[!is.na(corDF$correlation),]
      return(corDF[(corDF$correlation > minCorThresh) & (corDF$correlation < maxCorThresh),])

    } else {
      print("NOTHING PASSES FILTERS! Maybe reconsider filters?")
      return()
    }
}

traceGenesByMAG <- function(infoDF, covDF, binDF, bin, statsDF, focusGenes = NULL, minGeneCov=0, tax=makegtdbtktaxMat(), facetGrid=T, focusColor=NA, focusIn=NA,
                            sqrt_transform=F, log10_transform=T) {

  covDF <- covDF[covDF$key %in% as.character(infoDF[infoDF$bin == bin,"gene_callers_id"]),]  # get coverages for this MAG

    print(paste0(nrow(covDF), " genes in ", bin))

    if ((!is.null(focusGenes)) & is.na(focusColor)){
        covDF <- covDF[covDF$key %in% focusGenes,]
    }

    # get overall coverage for MAGs
    binTrace <- setNames(as.numeric(binDF[binDF$bins == bin, grep("A", colnames(binDF))]), grep("A", colnames(binDF), value = T))
    binTrace <- binTrace[mixedorder(names(binTrace))]  # sort human (e.g. AB1 comes before AB15 before AB2)


    # make long for ggplotting
    covDF <- melt(covDF, id.vars = 'key')
    colnames(covDF) <- c('Gene','Sample','Coverage')

    # order things nicely and make participant
    covDF$Gene <- factor(covDF$Gene)
    covDF$Day <- gsub("A[A-Z]","", as.character(covDF$Sample))
    covDF$Day <- factor(covDF$Day, mixedsort(unique(as.character(covDF$Day))))  # sort human
    covDF$Participant <- gsub("(A[A-Z]).*$","\\1",as.character(covDF$Sample))

    # grab genes above threshold
    if (minGeneCov > 0) {
      geneThresh <- ddply(covDF, ~ Gene + Participant, summarise, meanCov = mean(Coverage)) %>% filter(meanCov >= minGeneCov) %>% pull(Gene)
      covDF <- covDF[covDF$Gene %in% unique(geneThresh),]
    }


    # make a little dataframe to facilitate overlaying the bin's coverage
    binCov <- data.frame(Sample=factor(gsub("A[A-Z]","",names(binTrace)), levels = unique(gsub("A[A-Z]","",names(binTrace)))), Coverage=binTrace,
                         Participant = gsub("(A[A-Z]).*$","\\1",names(binTrace)))

    showLegend <- F
    if (length(unique(as.character(covDF$Gene))) <= 20) {
      showLegend <- "legend"
      print(setNames(infoDF$Pfam[match(unique(as.character(covDF$Gene)), infoDF$gene_callers_id)], unique(as.character(covDF$Gene))))
    } else {
      print("More than 20 genes are here, skipping legend and not dumping functions")
    }

    p <- ggplot(covDF, aes(x = Day, y = Coverage))

    if (is.na(focusColor)) {  ## case 1: no genes to focus
      p <- p + geom_line(aes(group = Gene), color='grey70', size = 0.1, alpha=0.6)
    } else if (is.na(focusIn)) {  ## case 2: genes to focus but globally, not participant specific
      geneColors <- setNames(rep('grey70', length(levels(covDF$Gene))), levels(covDF$Gene))
      geneColors[as.character(focusGenes)] <- focusColor
      p <- p + geom_line(aes(group = Gene, color=Gene), size = 0.1, alpha=0.6) +
        scale_color_manual(values = geneColors)
    } else {  ## case 3: genes to focus but in specific participants
      covDF$combinedGene <- paste0(as.character(covDF$Participant),"x",as.character(covDF$Gene))
      geneColors <- setNames(rep('grey70', nrow(covDF)), as.character(covDF$combinedGene))

      geneColors[paste0(as.character(focusIn),"x",as.character(focusGenes))] <- focusColor

      p <- p + geom_line(data=covDF, aes(group = combinedGene, color=combinedGene), size = 0.1, alpha=0.6) +  # reload data since updated here
        scale_color_manual(values = geneColors)
    }

  p <- p +
    geom_line(data = binCov, aes(group = Participant, x=Sample), size = 1, color = 'black') +
    scale_x_discrete(expand = c(0,0)) + labs(x="Sample Day") +
    labs(title=bin, subtitle = paste0(paste0(as.character(as.matrix(tax[tax$MAG == bin, c("Genus","Species")])), collapse = " "),  # this is "Genus sp."
                                      ": ",round(statsDF$completion[statsDF$MAG == bin],1), "% C / ", round(statsDF$redundancy[statsDF$MAG == bin], 1), "% R, ",
                                      round(statsDF$length[statsDF$MAG == bin]/1e6, 2), " Mb")) + guides(color=showLegend) +
    theme_basic + theme(strip.background = element_blank(), panel.spacing = unit(0.1, 'lines'), axis.ticks.x = element_line(), axis.text.x = element_text(size = 4))

    if (facetGrid){
      p <- p + facet_grid(~Participant, space = 'free_x', scales = 'free_x')
    } else {
      p <- p + facet_wrap(~Participant, ncol = ceiling(length(unique(covDF$Participant))/3), scales = 'free_x')
    }
    if (log10_transform){
      p <- p + scale_y_log10(expand = c(0,0))#, trans = 'log10', breaks = trans_breaks(trans = 'log10', inv = function(x) 10^(x + 1), n = 8))
    } else if (sqrt_transform){
      p <- p + scale_y_continuous(expand = c(0,0), trans = 'sqrt', breaks = trans_breaks(trans = 'sqrt', inv = function(x) x^2, n = 8))
    } else {
      p <- p + scale_y_continuous(expand = c(0,0))
    }

    print(p)
}


detrendGenesByMAG <- function(infoDF, covDF, binDF, bin, statsDF, focusGenes = NULL) {

  covDF <- covDF[covDF$key %in% as.character(infoDF[infoDF$bin == bin,"gene_callers_id"]),]  # get coverages for this MAG

    print(paste0(nrow(covDF), " genes in ", bin))

    if (!is.null(focusGenes)){
        covDF <- covDF[covDF$key %in% focusGenes,]
    }

    binTrace <- binDF[binDF$bins == bin, grep("A", colnames(binDF))]
    covDF[, grep("A", colnames(covDF))] <- covDF[, grep("A", colnames(covDF))] - matrix(binTrace)  # subtract bin cov vector from each gene vector

    # make long for ggplotting
    covDF <- melt(covDF, id.vars = 'key')
    colnames(covDF) <- c('Gene','Sample','Coverage')

    # order things nicely and make participant
    covDF$Gene <- factor(covDF$Gene)
    covDF$Day <- gsub("A[A-Z]","", as.character(covDF$Sample))
    covDF$Day <- factor(covDF$Day, mixedsort(unique(as.character(covDF$Day))))  # sort human
    covDF$Participant <- gsub("(A[A-Z]).*$","\\1",as.character(covDF$Sample))


    return(covDF)
}

detrendDistribution <- function(infoDF, covDF, binDF, bin, statsDF, focusGenes = NULL, sdMultiple=2, tax=makegtdbtktaxMat(), plot_it=T, focusColor='#Fa6a3a') {

  covDF <- detrendGenesByMAG(infoDF = infoDF, covDF=covDF, binDF=binDF, bin=bin, focusGenes = focusGenes)
  covDF <- covDF %>% group_by(Participant) %>% mutate(outlierInParticipant=Coverage > sdMultiple*sd(Coverage), outlierThresh=sdMultiple*sd(Coverage))

  if (plot_it){
    p <- ggplot(covDF, aes(Coverage, y=Participant)) +
      #geom_histogram(aes(y=..density..), bins = 20, fill='grey50') +
      #geom_density_ridges() +
      stat_density_ridges(bandwidth = 4) +
      #geom_density_ridges(stat='binline', bins=100) +
      geom_segment(aes(y=as.numeric(factor(Participant)), yend=as.numeric(as.factor(Participant)) + 1, x=outlierThresh, xend=outlierThresh), color=focusColor, linetype=2, size=0.5) +
      scale_y_discrete(expand = c(0,0)) + scale_x_continuous( n.breaks = 3) + labs(x="Coverage deviation") +
    labs(title=bin, subtitle = paste0(paste0(as.character(as.matrix(tax[tax$MAG == bin, c("Genus","Species")])), collapse = " "),  # this is "Genus sp."
                                      ": ",round(statsDF$completion[statsDF$MAG == bin],1), "% C / ", round(statsDF$redundancy[statsDF$MAG == bin], 1), "% R, ",
                                      round(statsDF$length[statsDF$MAG == bin]/1e6, 2), " Mb")) + guides(color=F) +
    theme_basic + theme(strip.background = element_blank(), panel.spacing = unit(0.1, 'lines'), axis.ticks.x = element_line())

      print(p)
  }

  covDF <- covDF %>% group_by()
    return(covDF)
}

plotCorrWithMAG <- function(corDF=correlateByBin(), sigThresh = 1, absCorThresh = 1, tax=makegtdbtktaxMat()){
    corDF <- corDF[corDF$p.value <= sigThresh,]

    corDF$gene <- factor(corDF$gene, levels = sort(unique(as.character(corDF$gene))))
    p <- ggplot(corDF, aes(x = gene, y = Individual)) +
        geom_tile(aes(fill = correlation)) +
        scale_y_discrete(expand = c(0,0)) +
        scale_fill_gradient2(low = 'blue', mid = 'lightgoldenrodyellow', high = 'red', midpoint = 0, limits = c(-1,1), na.value = 'grey10') +
        theme_basic
    print(p)

    return(corDF$gene[(corDF$correlation <= absCorThresh) & (!is.na(corDF$gene))])
}


plotFuncCounts <- function(vec=matched$`infoDF$Pfam[match(corDF$gene, infoDF$gene_callers_id)]`, minCount = 100, logAx='identity', title="", dropNA=F) {
  if (dropNA) {
    vec <- vec[vec != ""]
  }

  vec <- factor(vec, levels = levels(vec)[rev(order(table(vec)))])
  qplot(vec[vec %in% names(table(vec)[table(vec) >= minCount])]) + scale_y_continuous(expand = c(0,0), trans=logAx) +
    labs(x="Function", y="Count", title = title) +
    theme_basic_horizontal
}

plotDiversityTime <- function(matForDiv, title="MAG", method='simpson') {

  vec <- diversity(matForDiv, index = method, MARGIN = 2)

  df <- data.frame(div=vec, samp=names(vec), indiv=gsub("[0-9]*","",names(vec)))
  df$samp <- gsub("-","", df$samp)
  df$day <- gsub("A[A-Z]", "", as.character(df$samp))
  df$day <- factor(df$day, levels = mixedsort(unique(as.character(df$day))))

  p <- ggplot(df, aes(y=div, x=day, group=indiv)) +
    labs(x='Sample day', #title=paste0('Diversity: ', paste0(title, collapse = " ")),
         y = paste0(toupper(unlist(strsplit(method,""))[1]), paste0(unlist(strsplit(method,""))[-1], collapse = ""), " diversity")) +
    geom_line(stat = 'identity', color='black') + geom_point() +
    facet_grid(~indiv, scales = 'free_x', space = 'free_x') +
    scale_y_continuous(expand = c(0,.01)) + theme_basic_horizontal +
    theme(panel.spacing.x = unit(0.1, 'lines'), strip.background = element_blank(), axis.line.x.bottom = element_line(), axis.text.x = element_text(hjust=1))

  print(p)

  return(cbind(df,dataset=title))
}

correlateMagGenePairs <- function(geneCovs, geneInfo, binDetect, byIndiv=T, detectThresh=0.75, excludeOwn=F, corMeth='pearson',
                                  MAGs=unlist(sapply(levels(binDetect$bins), function(x) if(sum(binDetect[binDetect$bins == x, -1]>= detectThresh) >= 4) x))) {
  # function to loop through all pairs of genes in a MAG and correlate across indiviuals' samples in which the MAG was detected by some threshold
  # Ideally this can show how much linkage is within a mouth vs between mouths by the shape of the curve

  corVec <- c()
  for (MAG in MAGs) {
    mouths_detected_in <- table(gsub("[0-9]*","", colnames(binDetect)[which(binDetect[binDetect$bins == MAG,] >= detectThresh)]))
    mouths_detected_in <- names(mouths_detected_in)[mouths_detected_in >= 4]

    if (!byIndiv & (length(mouths_detected_in) > 0)){

      magCor <- cor(t(geneCovs[geneCovs$key %in% geneInfo$gene_callers_id[geneInfo$bin == MAG],
                               grep(paste0(mouths_detected_in, collapse = "|"), colnames(geneCovs))]), method = corMeth)

      magCor <- na.omit(magCor[lower.tri(magCor)])

      corVec <- c(corVec, magCor)
    } else {

      for (mouth in mouths_detected_in) {
        magCor <- cor(t(geneCovs[geneCovs$key %in% geneInfo$gene_callers_id[geneInfo$bin == MAG], grep(mouth, colnames(geneCovs))]), method = corMeth)

        magCor <- na.omit(magCor[lower.tri(magCor)])
        corVec <- c(corVec, magCor)
      }
    }
  }

  return(corVec)
}

correlateGenesAcrossMAGs <- function(geneCovs, geneInfo, binDetect, binCovs, byIndiv=T, detectThresh=0.75, excludeOwn=F, corMeth='pearson',
                                     MAGs=unlist(sapply(levels(binDetect$bins), function(x) if(sum(binDetect[binDetect$bins == x, -1]>= detectThresh) >= 4) x))){
  # subset to focal MAGs for speed if diong a subset
  geneCovs <- geneCovs[geneCovs$key %in% geneInfo[geneInfo$bin %in% MAGs,"gene_callers_id"],]

  corDF <- data.frame(gene=as.character(geneCovs$key), mouths_detected_in=NA, bin=NA, p.value=NA, correlation=NA)
  corDF$bin <- as.character(corDF$bin)
  corDF$mouths_detected_in <- as.character(corDF$mouths_detected_in)
  rownames(corDF) <- as.character(geneCovs$key)

  for (MAG in MAGs) {
    # subset to grab just mouths where this MAG is at least detect_thresh in 4 samples
    mouths_detected_in <- table(gsub("[0-9]*","", colnames(binDetect)[which(binDetect[binDetect$bins == MAG,] >= detectThresh)]))
    mouths_detected_in <- names(mouths_detected_in)[mouths_detected_in >= 4]
    print(mouths_detected_in)

    binTrace <- as.numeric(binCovs[binCovs$bins == MAG, grep(paste0(mouths_detected_in, collapse = "|"), colnames(binCovs))])

    # for each gene in this MAG's genes
    for (gene in unique(as.character(geneCovs$key[geneCovs$key %in% geneInfo$gene_callers_id[geneInfo$bin == MAG]]))){

    geneTrace <- as.numeric(geneCovs[geneCovs$key == gene, grep(paste0(mouths_detected_in, collapse = "|"), colnames(geneCovs))])

    geneCor <- cor.test(geneTrace, binTrace, method = corMeth, exact = F)

    corDF[gene,c("p.value","correlation")] <- c(p.value=geneCor$p.value, correlation=geneCor$estimate)
    corDF$mouths_detected_in[corDF$gene == gene] <- paste0(mouths_detected_in, collapse = "|")
    corDF$bin[corDF$gene == gene] <- MAG

    }

  }
  return(corDF)
}

fetchVariabilityCDNForGenes <- function(genes=c("3555"), geneInfo){
  bin <- unique(as.character(geneInfo$bin[geneInfo$gene_callers_id %in% genes]))

  varData <- read.csv(paste0('catalyst_idba/codon_var/', bin, '-var-CDN.tsv'), sep = "\t")

  varData <- varData[varData$corresponding_gene_call %in% genes,]

  return(varData)
}


codonSynonByMAG <- function(MAG_list, geneInfo, geneCovs, binCovs, corMat=geneVsMAG, corThresh=0.2, minMedCov=2, greaterThan=F){
  corMat <- corMat[!is.na(corMat$correlation),]

  all_syn <- data.frame(MAG=character(), synonymity=numeric())
  for (MAG in MAG_list){

    if (greaterThan) {
      genes_not_correlated <- as.character(corMat$gene[abs(corMat$correlation) >= corThresh & (corMat$bin == MAG)])
    } else {
      genes_not_correlated <- as.character(corMat$gene[abs(corMat$correlation) <= corThresh & (corMat$bin == MAG)])
    }

    print(paste0(length(genes_not_correlated), " genes meeting criteria (", MAG,")"))
    if (!(MAG %in% gsub("-var-CDN.tsv", "", list.files("catalyst_idba/codon_var/")))) {
      print(paste0(MAG, " has no associated variability file..."))
      next()
    }

    if (length(genes_not_correlated) > 0){  # some MAGs might not have any genes meeting criteria

      varinfo <- fetchVariabilityCDNForGenes(genes = genes_not_correlated, geneInfo = geneInfo)

      varinfo <- varinfo[grep(unique(corMat$mouths_detected_in[corMat$bin == MAG]), varinfo$sample_id),]

      genes_with_var <- varinfo$corresponding_gene_call
      mag_syn <- varinfo$synonymity
      gene_lengths <- varinfo$gene_length
      sample_id <- varinfo$sample_id

      if (length(mag_syn) == 0){
        print("No codon information for any of ^these genes")
        next()
      }

      all_syn <- rbind(all_syn, data.frame(MAG=MAG, synonymity=mag_syn, gene=genes_with_var, gene_length=gene_lengths, sample=sample_id))
    }
  }
  return(all_syn)
}
Reading the processed data
#########################
##        DATA         ##
#########################
gene_info <- read.csv('catalyst_idba/NON-REDUNDANT-MAGs-gene_info.txt', sep="\t", header = T)
gene_covs <- read.csv('catalyst_idba/NON-REDUNDANT-MAGs-GENE-COVERAGES.txt', sep = "\t", header = T)
gene_detect <- read.csv('catalyst_idba/NON-REDUNDANT-MAGs-GENE-DETECTION.txt', sep = "\t", header = T)
bin_covs <- read.csv('catalyst_idba/NON-REDUNDANT-MAGs-SUMMARY/bins_across_samples/mean_coverage.txt', sep = "\t", header =T)
bin_detect <- read.csv('catalyst_idba/NON-REDUNDANT-MAGs-SUMMARY/bins_across_samples/detection.txt', sep = "\t", header =T)
bin_stats <- read.csv('catalyst_idba/REDUNDANT-MAGs-STATS.txt', sep = "\t", header = T)
eggnog <- read.csv('catalyst_idba/eggnog_annotations.tsv', sep = "\t" , header = T)
rownames(eggnog) <- eggnog$query_name
gtdbtk <- makegtdbtktaxMat()

rownames(gene_info) <- gene_info$gene_callers_id
gene_covs <- gene_covs[-46594,]  # remove duplicate gene caller id from AN as it is an AO gene according to gene_info
gene_detect <- gene_detect[-46594,]  # same for gene_detect
rownames(gene_covs) <- gene_covs$key
Final figures
S. Figure 1
Overall MAG taxonomy:
gtdbtk$Genus <- factor(gtdbtk$Genus, levels = names(table(gtdbtk$Genus))[order(table(gtdbtk$Genus))])
ggplot(gtdbtk, aes(x=Genus, fill=Genus, group=Genus)) +
  geom_histogram(stat = 'count', position = 'identity') + labs(x="Genus", y = "MAG Count") +
  scale_fill_manual(values = c(grey.colors(15,rev = T),rev(dans_colors)), guide=F) + coord_flip() +
  scale_y_continuous(expand = c(0,0)) + theme_basic +
  theme(panel.spacing = unit(0.1, 'line'), strip.background = element_rect(fill='#EaEaEa'), axis.ticks.x = element_line(color='black'), axis.text.y = element_text(size=6),
        panel.grid.minor.x = element_line(), panel.grid.major.x = element_line())
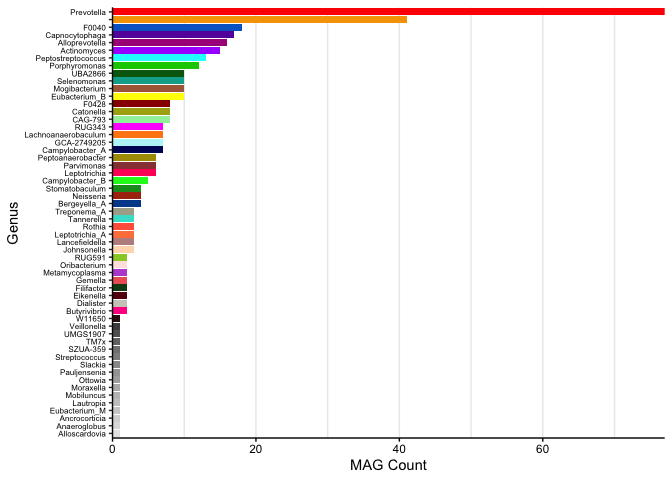
Fig 1A
Cartoon of how the anvi’o metric ‘detection’ (horizontal coverage) works, for Figure 1A
plotDetectionCartoon <- function(gene_data, geneInfo, focalMAGs, log=F, gtdbtk=makegtdbtktaxMat(), colorGenes=NA) {

    gene_data <- gene_data[gene_data$key %in% geneInfo$gene_callers_id[geneInfo$bin %in% focalMAGs],]
  gene_data$MAG <- geneInfo$bin[match(gene_data$key, geneInfo$gene_callers_id)]

  df <- melt(gene_data, id.vars = c("key","MAG"))

  colnames(df)[colnames(df) == "variable"] <- "sample"

  df$sample <- factor(df$sample, levels = mixedsort(unique(as.character(df$sample))))
  df$value <- as.numeric(as.character(df$value))
  df$key <- factor(df$key, levels = sort(unique(as.numeric(as.character(df$key)))))
  df$MAG <- factor(df$MAG, levels = sort(unique(as.character(df$MAG))))

  df <- df[order(df$MAG, df$sample, df$key),]

  if (log) {
    df$value <- log10(df$value + 1)
  }

  geneColors <- setNames(rep('black',length(levels(df$key))), levels(df$key))
  geneColors[colorGenes] <- 'red'

  df$detected <- "not"
  df$detected[df$value > 0] <- "yes"

  detectDF <- df[cumsum(rle(as.character(df$detected))$lengths),]

  p <- ggplot(na.omit(df), aes(x=key, y = value)) +
    geom_segment(aes(x=key, xend=key, y=0, yend=Inf, color=detected)) +
    geom_col(fill='black', color='black', size=0.1)

  if (log) {
    p <- p + facet_grid(sample~MAG, scales='free_y')
  } else {
    p <- p + facet_grid(sample~MAG, scales = 'free_y')
  }

  p <- p + #scale_fill_manual(values = geneColors) +
    scale_color_manual(values = setNames(c("#Ba52B2","#FfB6E1"),c("yes","not"))) +
    labs(y = "Coverage", x = "Gene") + scale_y_continuous(n.breaks = 3) +
    theme_basic + theme(legend.position = 'none') +
    theme(panel.border = element_blank(), axis.text.x = element_blank(), axis.ticks.y = element_blank(), panel.spacing = unit(0, "lines"),
          axis.text.y = element_text(size=5), strip.text.y = element_text(size=4))

  return(p)
}

plotDetectionCartoon(gene_covs[,grep("key|AB1|AC|AI15", colnames(gene_covs))], gene_info, focalMAGs = 'FINAL_AI_MAG_00008', log = T)
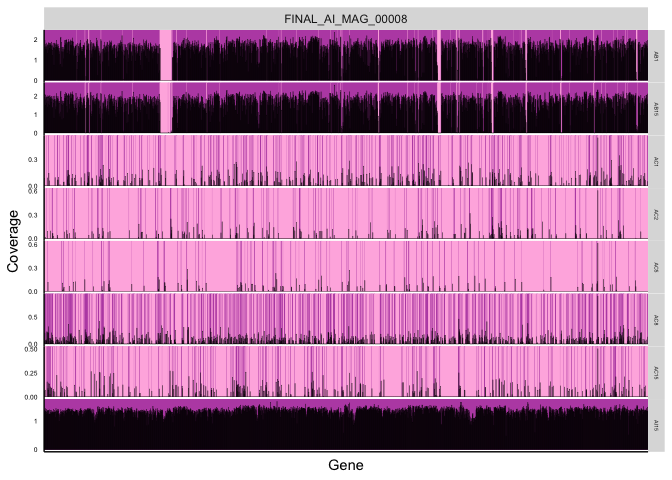
Figure 1 C
plotDiversityTime(matForDiv = bin_covs[,2:ncol(bin_covs)], title = "MAGs", method = 'simpson')
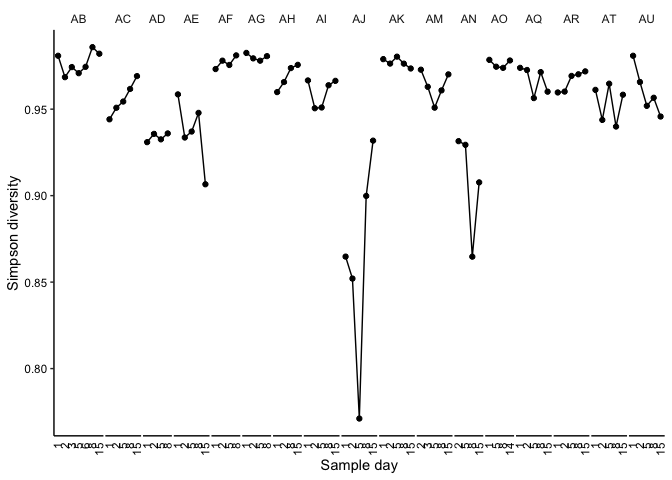
##            div samp indiv day dataset
## AB1  0.9808752  AB1    AB   1    MAGs
## AB15 0.9820555 AB15    AB  15    MAGs
## AB2  0.9684930  AB2    AB   2    MAGs
## AB3  0.9743385  AB3    AB   3    MAGs
## AB5  0.9708051  AB5    AB   5    MAGs
## AB6  0.9744770  AB6    AB   6    MAGs
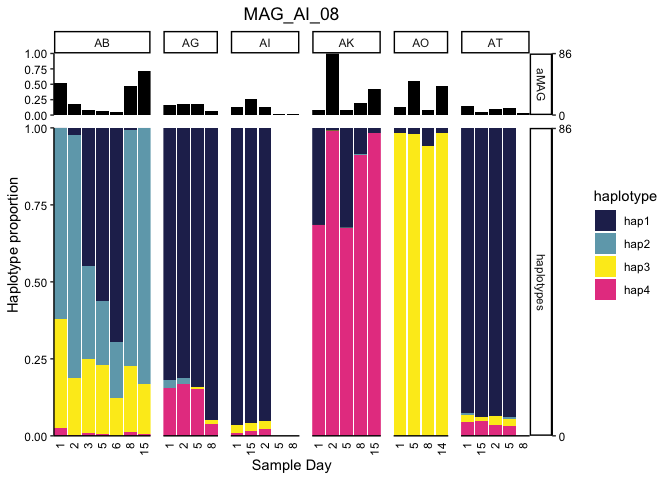
Fig. 2BC, SFig 5
We can plot the proportion of each MAG explained by each haplotype for each metagenome (e.g., Figure 2BC) or loop through them all (Supplemental Figure 5) by uncommenting the for loop:
MAG <- "FINAL_AI_MAG_00008"

#for (MAG in gsub("-Bacteria.*$","", gsub("binDESMAN/","",desStrains$base_pred_file))) {

numStrains <- desStrains$nHap[grep(MAG,desStrains$base_pred_file)]

if (length(list.files(paste0("catalyst_idba/mag_bacteria71_genes/", MAG, "-Bacteria_71-SNVs-DESMAN-FINAL_",numStrains,"_0/"))) < 2) {
  # that means the expected files aren't there, print that we're missing and skip
  print(paste0("Missing files for ", MAG, " with n_hap=", numStrains))
  next()
}

desmanFreq <- read.csv(paste0("catalyst_idba/mag_bacteria71_genes/", MAG, "-Bacteria_71-SNVs-DESMAN-FINAL_",numStrains,"_0/Gamma_mean.csv"), header = T,
                       col.names = c("sample", paste0("hap", 1:as.numeric(numStrains))))

desmanFreq <- melt(desmanFreq)
colnames(desmanFreq) <- c("sample","haplotype","frequency")
desmanFreq$indiv <- factor(gsub("[0-9]*","", desmanFreq$sample))
desmanFreq$day <- factor(gsub("A[A-Z]", "", desmanFreq$sample), levels = mixedsort(unique(gsub("A[A-Z]", "", desmanFreq$sample))))
desmanFreq$category <- 'haplotypes'

magCov <- bin_covs[bin_covs$bins == MAG,2:ncol(bin_covs)]
magDF <- data.frame(sample=names(magCov), frequency=as.numeric(magCov)/max(as.numeric(magCov)))
magDF$indiv <- factor(gsub("[0-9]*","", magDF$sample))

magDF <- magDF[magDF$indiv %in% desmanFreq$indiv,]
magDF$day <- factor(gsub("A[A-Z]", "", magDF$sample), levels = mixedsort(unique(gsub("A[A-Z]", "", as.character(magDF$sample)))))
magDF$category <- 'aMAG'

p <- ggplot(desmanFreq, aes(x=day, y = frequency)) + ggtitle(gsub("(^.*)(MAG_)(.*$)","\\2\\1\\3", gsub("_000","_", gsub("FINAL_","",MAG)))) +
  geom_col(aes(fill=haplotype)) +
  geom_col(data=magDF, fill='black', aes(group=indiv)) + facet_grid(category~indiv, space = 'free_x', scales='free_x') +  # SINGLE
  #geom_line(data=magDF, stat = 'identity', color=NA, aes(group=indiv)) + facet_grid(.~indiv, space = 'free_x', scales='free_x') +  # LOOP FOR ALL
  scale_y_continuous(expand = c(0,0), sec.axis = sec_axis(~. * max(as.numeric(magCov)), breaks =function(x) c(0, floor(x[2])))) +
  scale_x_discrete(expand = c(0,0)) + labs(x='Sample Day', y = 'Haplotype proportion') +
  scale_fill_manual(values = c(beyonce_palette(66)[seq(from = 1, to = 11, length.out = min(11,length(levels(desmanFreq$haplotype))))], rainbow(9))) +
  theme_classic() + theme(axis.ticks.x = element_blank(), axis.text = element_text(color = 'black'), plot.title = element_text(hjust = 0.5),
                                       plot.subtitle = element_text(hjust = 0.5), axis.text.x = element_text(color = 'black', angle = 90, hjust = 1, vjust = 0.5),
                                       panel.spacing = unit(4/length(levels(desmanFreq$indiv)), 'lines'))

# for single:
g <- ggplot_gtable(ggplot_build(p))
g$heights[8] <- .2*g$heights[8]  # set the top facet row to be 20% of the height
grid.draw(g)
# for loop:
#print(p)
#}
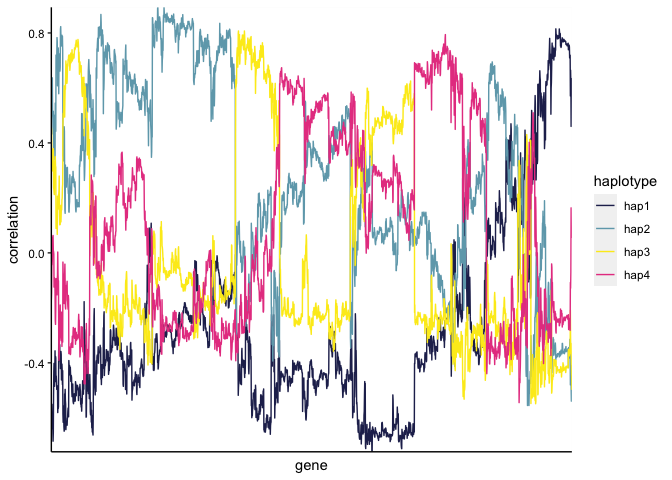
Supplemental Figure 6A
And then we can assess the genes correlated with a specific haplotype, as in Supplemental Figure 6A:
MAG <- "FINAL_AI_MAG_00008"

numStrains <- desStrains$nHap[grep(MAG,desStrains$base_pred_file)]

desmanFreq <- read.csv(paste0("catalyst_idba/mag_bacteria71_genes/", MAG, "-Bacteria_71-SNVs-DESMAN-FINAL_",numStrains,"_0/Gamma_mean.csv"), header = T,
                       col.names = c("sample", paste0("hap", 1:as.numeric(numStrains))))

# get the genes from the samples the haplotypes are detected in (might be different from coverage due to SNV coverage depth)
relevantGeneSamps <- gene_covs[gene_covs$key %in% gene_info$gene_callers_id[gene_info$bin == MAG], c('key', as.character(desmanFreq$sample))]

hapCor <- cor(desmanFreq[,2:ncol(desmanFreq)],t(relevantGeneSamps[,2:ncol(relevantGeneSamps)]))

colnames(hapCor) <- as.character(relevantGeneSamps$key)

hapCorFilled <- hapCor
hapCorFilled[is.na(hapCorFilled)] <- 0
geneOrder <- hclust(vegdist(t(hapCorFilled), method = 'euc'), method = 'complete')

hapWide <- melt(hapCor)
colnames(hapWide) <- c("haplotype","gene","correlation")
hapWide$gene <- factor(hapWide$gene, levels = geneOrder$labels[geneOrder$order])

# genes associated with Hap4
hap4genes <- hapCor[,(hapCor["hap2",] > 0.8) & apply(hapCor[paste0("hap",c(1,3,4)),], 2, function(x) all(x < 0.2))]

ggplot(hapWide, aes(x=gene, y = correlation, group=haplotype)) +
  geom_line(aes(color=haplotype)) +
  scale_y_continuous(expand = c(0,0)) + scale_x_discrete(expand = c(0,0)) +
  scale_color_manual(values = c(beyonce_palette(66)[seq(from = 1, to = 11, length.out = min(11,length(levels(hapWide$haplotype))))], rainbow(9))) +
  theme(axis.ticks.x = element_blank(), axis.text = element_text(color = 'black'), plot.title = element_text(hjust = 0.5),
        plot.subtitle = element_text(hjust = 0.5), strip.background = element_rect(fill = '#dcdcdc', colour = NA),
        axis.text.x = element_blank(), axis.line = element_line())
Supplemental Figure 6C
ai_08_gcs <- droplevels(gene_info[gene_info$bin == "FINAL_AI_MAG_00008",])
ai_08_gcs$association <- 'Other'
ai_08_gcs$association[ai_08_gcs$gene_callers_id %in% colnames(hap4genes)] <- 'Haplotype 4'
ai_08_gcs$contig <- factor(ai_08_gcs$contig, levels=names(sort(table(ai_08_gcs$contig), decreasing = F)))

ggplot(ai_08_gcs) +
  geom_bar(aes(y=contig, fill=association), position='stack', width=0.7) +
  scale_x_continuous(expand = c(0,0)) + labs(y=paste0("Contigs in MAG_AI_08 (n=", length(levels(ai_08_gcs$contig)),")"), x="Number of genes", fill="Associated with:") +
  scale_fill_manual(values = c('#E74690','grey50')) + guides(fill=guide_legend(nrow=2)) +
  theme_basic + theme(axis.text.y = element_blank(), legend.position = c(.6, .15), legend.background = element_rect(color='black', size=0.25),
                      axis.ticks.x = element_line(), axis.ticks.y = element_blank())
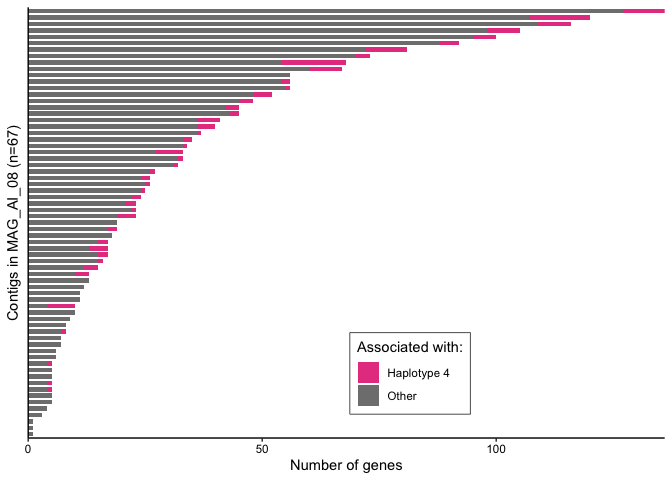
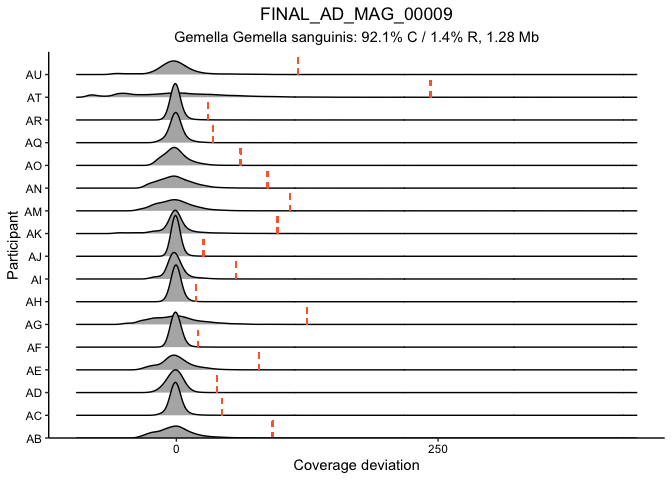
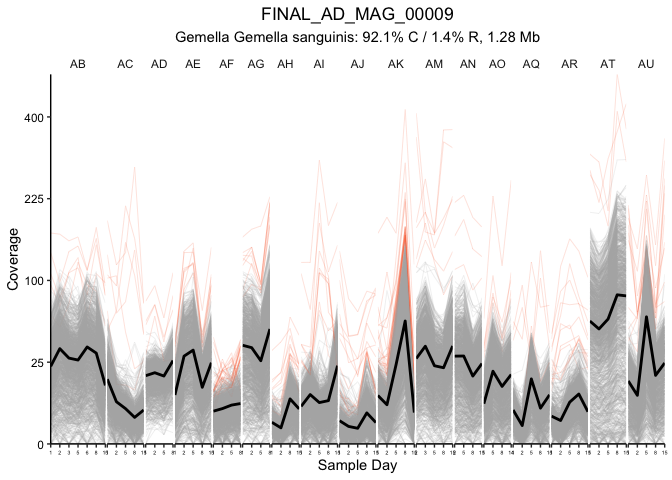
Fig. 3A and S. Fig 7
This block generates figure 3A and the corresponding supplemental
figures 7 and 8. The first plot generated is SFig. 7, which shows the
distribution of detrended coveage (relative to the parent MAG) for each
gene in MAG_AD_09 by donor. This confirms that genes above 5 standard
deviations are truly outliers. Figure 3A then plots the coverage of each
gene (thin line) in the MAG for each timepoint along with the MAG
coverage (thick line). Colored lines mark the genes with more than 5
standard deviations above the average detrended coverage by donor.
# supplemental figure 7: sd distributions for MAG_AD_09
ad09_5sd <- detrendDistribution(gene_info, gene_covs, bin_covs, bin="FINAL_AD_MAG_00009", bin_stats, plot_it = T,
                focusGenes = NULL, sdMultiple = 5)

## [1] "1439 genes in FINAL_AD_MAG_00009"
# Figure 3A - gene traces
traceGenesByMAG(gene_info, gene_covs, bin_covs, bin="FINAL_AD_MAG_00009", bin_stats, facetGrid = T, log10_transform = F, sqrt_transform = T, focusColor='#Fa6a3a',
                focusGenes = as.character(ad09_5sd$Gene[ad09_5sd$outlierInParticipant]),
                focusIn=as.character(ad09_5sd$Participant[ad09_5sd$outlierInParticipant]))

## [1] "1439 genes in FINAL_AD_MAG_00009"
## [1] "More than 20 genes are here, skipping legend and not dumping functions"
We then generated Supplemental Table 3 (Pfam annotations for these highlighted outlier genes):
length(unique(ad09_5sd$Gene[ad09_5sd$outlierInParticipant]))

## [1] 48

setNames(as.character(gene_info[unique(as.character(ad09_5sd$Gene[ad09_5sd$outlierInParticipant])),"Pfam"]), unique(as.character(ad09_5sd$Gene[ad09_5sd$outlierInParticipant])))


s_table3 <-cbind(gene=unique(as.character(ad09_5sd$Gene[ad09_5sd$outlierInParticipant])),
                 Pfam = as.character(gene_info[unique(as.character(ad09_5sd$Gene[ad09_5sd$outlierInParticipant])),"Pfam"]),
                 eggnog[unique(as.character(ad09_5sd$Gene[ad09_5sd$outlierInParticipant])), c("COG_Category", "Preferred_name","KEGG_ko","EC"),])

print(head(s_table3))

##          gene                                       Pfam COG_Category
## NA     165278                                                    <NA>
## 165279 165279                                                       S
## 165031 165031 Bacterial regulatory proteins, tetR family            K
## 164689 164689                     TfoX N-terminal domain            K
## NA.1   165280                                                    <NA>
## 164484 164484              Glycosyl transferase family 2            S
##        Preferred_name   KEGG_ko   EC
## NA               <NA>      <NA> <NA>
## 165279
## 165031
## 164689                ko:K07343
## NA.1             <NA>      <NA> <NA>
## 164484           ycbB ko:K00786
Figure 3BC
First we looped through all MAGs to get the total outlier genes from the entire dataset:
mags_to_check <- unlist(sapply(levels(bin_detect$bins), function(x) if(sum(bin_detect[bin_detect$bins == x, -1]>= 0.50) >= 15 ) x))
length(mags_to_check)

## [1] 199

for (mag in mags_to_check) {
  single_outliers <- detrendDistribution(gene_info, gene_covs, bin_covs, bin=mag, bin_stats, plot_it=F,
                focusGenes = NULL, sdMultiple = 5)

  single_outliers <- single_outliers[single_outliers$outlierInParticipant,]

  if (mag == mags_to_check[1]){
    mag_outliers <- data.frame(MAG=mag, Gene=unique(as.character(single_outliers$Gene)))
  } else {
    mag_outliers <- rbind(mag_outliers, data.frame(MAG=mag, Gene=unique(as.character(single_outliers$Gene))))
  }
}
Then this plotting function was defined to display the data:
processOutlierFunctions <- function(outliers=mag_outliers, func_category='COG_Category', minCount=3, dropBlank=T){

  if (func_category %in% colnames(gene_info)){
    outliers[,func_category] <- gene_info[as.character(outliers$Gene),func_category]
  } else {
    outliers[,func_category] <- eggnog[as.character(outliers$Gene),func_category]
  }

  if (dropBlank){
    outliers <- outliers[!(outliers[,func_category] %in% c("",NA)),]
  }

  outliers <- outliers %>% mutate(count=1) %>% group_by(.dots=func_category) %>% summarise(mean=sum(count), sd=sd(count))

  outliers <- as.data.frame(outliers)

  outliers <- outliers[outliers$mean >= minCount,]
  outliers[,func_category] <- as.character(outliers[,func_category])

  outliers[outliers[,func_category] %in% names(cogValues),func_category] <- cogValues[outliers[,func_category][outliers[,func_category] %in% names(cogValues)]]

  outliers[,func_category] <- factor(outliers[,func_category], levels = unique(as.character(outliers[order(outliers$mean, decreasing = F),func_category])))

  p <- ggplot(outliers, aes_string(y=func_category, x = "mean")) +
  geom_col(fill='#a0dff8ff') + labs(x="Count in all outliers", y=gsub("_"," ", func_category)) +
  scale_x_continuous(expand = c(0,0)) +
  theme_classic() + theme(axis.ticks = element_line(color='black'), panel.grid.major.x = element_line())

  print(p)

  return(outliers)
}
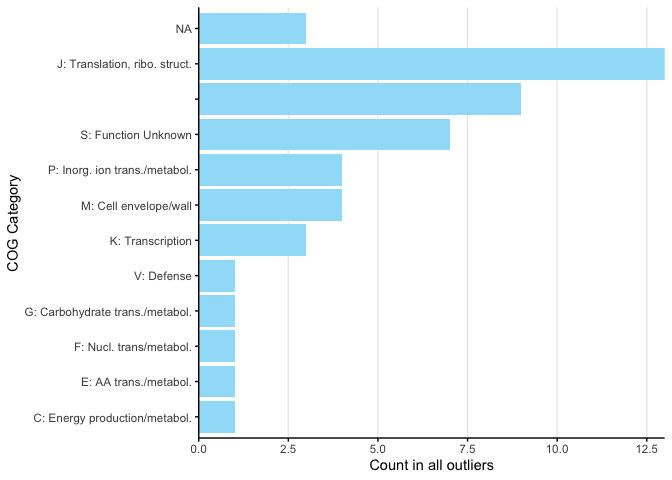
With this function Figure 3B was plotted like so:
ad09_5sd$MAG <- "FINAL_AD_MAG_00009"
x <- processOutlierFunctions(unique(ad09_5sd[ad09_5sd$outlierInParticipant,c("MAG","Gene")]), func_category = 'COG_Category', minCount = 1)
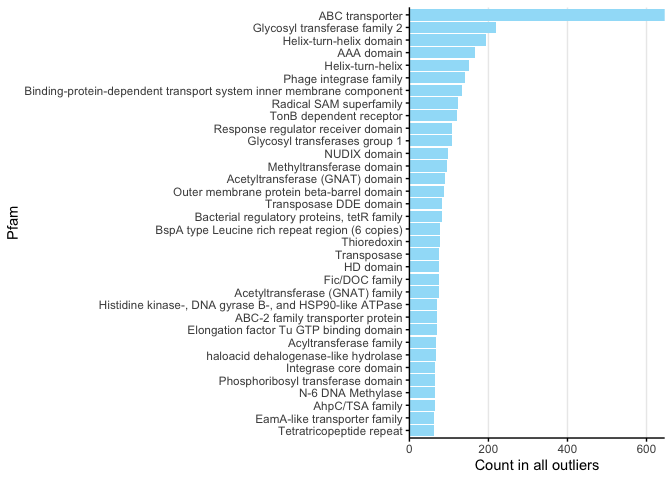
For Figure 3C, for brevity we only plotted the COG categories above 60 and then cropped the output plot.
x <- processOutlierFunctions(mag_outliers, func_category = 'Pfam', minCount =60, dropBlank=T)

## `summarise()` ungrouping output (override with `.groups` argument)
S. Fig. 8
To assess the overall coupling (or decoupling) of genes, we computed all possible pairwise correlations for MAGs meeting a detection criterion of >0.75 in varying numbers of samples:
corYesByIndiv30 <- correlateMagGenePairs(geneCovs = gene_covs, binDetect = bin_detect, geneInfo = gene_info, detectThresh = 0.75, byIndiv = T,
                                         MAGs=unlist(sapply(levels(bin_detect$bins),
                                                            function(x) if(sum(bin_detect[bin_detect$bins == x, -1]>= 0.75) >= 30) x)))


corYesByIndiv20 <- correlateMagGenePairs(geneCovs = gene_covs, binDetect = bin_detect, geneInfo = gene_info, detectThresh = 0.75, byIndiv = T,
                                         MAGs=unlist(sapply(levels(bin_detect$bins),
                                                            function(x) if(sum(bin_detect[bin_detect$bins == x, -1]>= 0.75) >= 20) x)))


corYesByIndiv40 <- correlateMagGenePairs(geneCovs = gene_covs, binDetect = bin_detect, geneInfo = gene_info, detectThresh = 0.75, byIndiv = T,
                                         MAGs=unlist(sapply(levels(bin_detect$bins),
                                                            function(x) if(sum(bin_detect[bin_detect$bins == x, -1]>= 0.75) >= 40) x)))


geneVarStats <- function(df=corNotByIndiv40, subsampleTo=1E6){
  med <- median(df)
  ave <- mean(df)
  sdiv <- sd(df)
  ma <- max(df)
  mi <- min(df)
  quants <-  quantile(df)
  return(data.frame(median=med, average=ave, max=ma, min=mi, sd=sdiv, q1=quants[2], q3=quants[4], correlations=sample(df, subsampleTo)))
}

cors <- rbind(cbind(indiv="ByIndividual", numIndiv=40, geneVarStats(corYesByIndiv40)),
              cbind(indiv="ByIndividual", numIndiv=30, geneVarStats(corYesByIndiv30)),
              cbind(indiv="ByIndividual", numIndiv=20, geneVarStats(corYesByIndiv20)))

rm(corYesByIndiv40, corYesByIndiv30, corYesByIndiv20)  # to free up memory
#corYesByIndiv10 <- correlateMagGenePairs(geneCovs = gene_covs, binDetect = bin_detect, geneInfo = gene_info, detectThresh = 0.75, byIndiv = T,
#                                         MAGs=unlist(sapply(levels(bin_detect$bins),
#                                                            function(x) if(sum(bin_detect[bin_detect$bins == x, -1]>= 0.75) >= 10) x)))
#cors <- rbind(cors, cbind(indiv="ByIndividual", numIndiv=10, geneVarStats(corYesByIndiv10)))
#rm(corYesByIndiv10)

corNotByIndiv40 <- correlateMagGenePairs(geneCovs = gene_covs, binDetect = bin_detect, geneInfo = gene_info, detectThresh = 0.75, byIndiv = F,
                                         MAGs=unlist(sapply(levels(bin_detect$bins),
                                                            function(x) if(sum(bin_detect[bin_detect$bins == x, -1]>= 0.75) >= 40) x)))


corNotByIndiv30 <- correlateMagGenePairs(geneCovs = gene_covs, binDetect = bin_detect, geneInfo = gene_info, detectThresh = 0.75, byIndiv = F,
                                         MAGs=unlist(sapply(levels(bin_detect$bins),
                                                            function(x) if(sum(bin_detect[bin_detect$bins == x, -1]>= 0.75) >= 30) x)))


corNotByIndiv20 <- correlateMagGenePairs(geneCovs = gene_covs, binDetect = bin_detect, geneInfo = gene_info, detectThresh = 0.75, byIndiv = F,
                                         MAGs=unlist(sapply(levels(bin_detect$bins),
                                                            function(x) if(sum(bin_detect[bin_detect$bins == x, -1]>= 0.75) >= 20) x)))


corNotByIndiv10 <- correlateMagGenePairs(geneCovs = gene_covs, binDetect = bin_detect, geneInfo = gene_info, detectThresh = 0.75, byIndiv = F,
                                         MAGs=unlist(sapply(levels(bin_detect$bins),
                                                            function(x) if(sum(bin_detect[bin_detect$bins == x, -1]>= 0.75) >= 10) x)))

corNotByIndiv5 <- correlateMagGenePairs(geneCovs = gene_covs, binDetect = bin_detect, geneInfo = gene_info, detectThresh = 0.75, byIndiv = F,
                                        MAGs=unlist(sapply(levels(bin_detect$bins),
                                                           function(x) if(sum(bin_detect[bin_detect$bins == x, -1]>= 0.75) >= 5) x)))


cors <- rbind(cors,
              cbind(indiv="NotByIndividual", numIndiv=40, geneVarStats(corNotByIndiv40)),
              cbind(indiv="NotByIndividual", numIndiv=30, geneVarStats(corNotByIndiv30)),
              cbind(indiv="NotByIndividual", numIndiv=20, geneVarStats(corNotByIndiv20)),
              cbind(indiv="NotByIndividual", numIndiv=10, geneVarStats(corNotByIndiv10)),
              cbind(indiv="NotByIndividual", numIndiv=5, geneVarStats(corNotByIndiv5)))
Final prep and plotting:
densiCor <- cors %>% group_by(indiv, numIndiv, q1, q3, median) %>% summarise(densY= list(density(correlations)$y), densX=list(density(correlations)$x)) %>% unnest(c(densY,densX))
densiCor$q1q3 <- (densiCor$densX >= densiCor$q1) * (densiCor$densX <= densiCor$q3)
densiCor$q1q3[densiCor$densX >= densiCor$q3] <- 3
densiCor <- densiCor %>% group_by(indiv, numIndiv) %>% mutate(medianY=densY[which.min(abs(densX-median))])

ggplot(densiCor[abs(densiCor$densX) <= 1,], aes(x=densX, y=densY, color=indiv)) +
  geom_line() +
  geom_ribbon(aes(ymin=0, ymax=densY, fill=interaction(indiv,factor(q1q3)))) +
  geom_segment(data=densiCor[!duplicated(densiCor[,-c(6,7)]),], y=0, aes(x=median, xend=median, yend=medianY, color=indiv)) +
  facet_grid(numIndiv~., switch = 'y', scales='free_y', space = 'free_y') +
  scale_x_continuous(expand = c(0,0), limits = c(-1,1)) + scale_y_continuous(position = 'right', expand = c(0,0)) +
  scale_color_manual(values = c('#00AaFa','#Fa6a3a44'), labels=c("Mouth-by-mouth", "Across mouths")) +
  scale_fill_manual(values = c(NA,NA,'#00AaFa44','#Fa6a3a44',NA,NA), breaks = c(3,4), labels=c("Mouth-by-mouth", "Across mouths")) +
  labs(x="Pearson correlation coefficient", sec.y = "Number of samples detected in\n(at least 75% of MAG's nucleotides covered)",
       fill="Correlation\nscope", color="Correlation\nscope", y='Density') +
  theme_bw() + theme_basic + theme(axis.ticks.x = element_line())
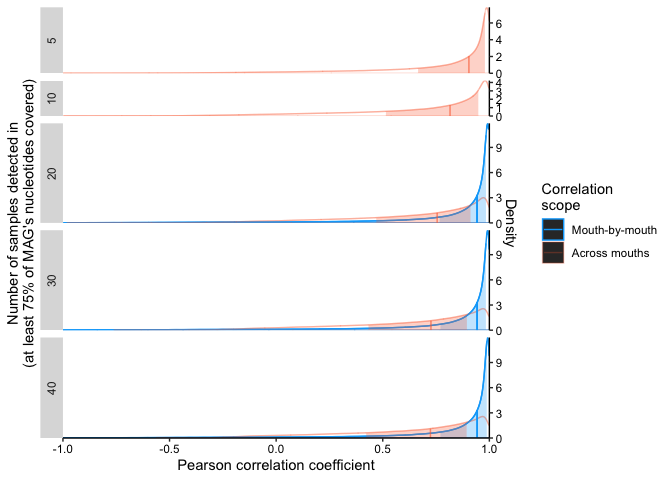
Figure 4
We then turned to look at nucleotide variability data to assess the frequency of single codon variants, specifically whether decoupled genes were enriched in non-synonymous codon variants (indicative of phenomena like HGT into distinct populations), and whether non-synonymous codons sweep through a population over the two-week windoe or remain stable.
geneVsMAG <- correlateGenesAcrossMAGs(geneCovs = gene_covs, binDetect = bin_detect, geneInfo = gene_info, binCovs = bin_covs, detectThresh = 0.75, byIndiv = F,
                                      MAGs=unlist(sapply(levels(bin_detect$bins),
                                                         function(x) if(sum(bin_detect[bin_detect$bins == x, -1]>= 0.75) >= 40) x)))


quantile(abs(geneVsMAG$correlation), probs = c(0.01,0.1,0.9,0.99), na.rm = T)  # USE TO GET GOOD VALUES for next step!

##         1%        10%        90%        99%
## 0.03641639 0.41827478 0.98533270 0.99720204

synUnlinked01 <- codonSynonByMAG(MAG_list = unique(as.character(geneVsMAG$bin)), corMat = geneVsMAG, gene_info, gene_covs, bin_covs, corThresh = 0.0364, greaterThan=F)

## [1] "0 genes meeting criteria (FINAL_AT_MAG_00012)"
## [1] "4 genes meeting criteria (FINAL_AJ_MAG_00005)"
## [1] "FINAL_AJ_MAG_00005 has no associated variability file..."
## [1] "14 genes meeting criteria (FINAL_AE_MAG_00012)"
## [1] "97 genes meeting criteria (FINAL_AC_MAG_00033)"
## [1] "FINAL_AC_MAG_00033 has no associated variability file..."
## [1] "43 genes meeting criteria (FINAL_AN_MAG_00021)"
## [1] "FINAL_AN_MAG_00021 has no associated variability file..."
## [1] "20 genes meeting criteria (FINAL_AD_MAG_00009)"
## [1] "0 genes meeting criteria (FINAL_AC_MAG_00020)"
## [1] "14 genes meeting criteria (FINAL_AE_MAG_00015)"
## [1] "1 genes meeting criteria (FINAL_AC_MAG_00006)"
## [1] "No codon information for any of ^these genes"
## [1] "63 genes meeting criteria (FINAL_AQ_MAG_00003)"
## [1] "2 genes meeting criteria (FINAL_AD_MAG_00003)"
## [1] "No codon information for any of ^these genes"
## [1] "9 genes meeting criteria (FINAL_AJ_MAG_00003)"
## [1] "18 genes meeting criteria (FINAL_AI_MAG_00002)"
## [1] "FINAL_AI_MAG_00002 has no associated variability file..."
## [1] "32 genes meeting criteria (FINAL_AR_MAG_00012)"
## [1] "FINAL_AR_MAG_00012 has no associated variability file..."
## [1] "73 genes meeting criteria (FINAL_AE_MAG_00007)"
## [1] "FINAL_AE_MAG_00007 has no associated variability file..."
## [1] "8 genes meeting criteria (FINAL_AJ_MAG_00008)"
## [1] "7 genes meeting criteria (FINAL_AC_MAG_00034)"
## [1] "FINAL_AC_MAG_00034 has no associated variability file..."
## [1] "4 genes meeting criteria (FINAL_AD_MAG_00002)"
## [1] "0 genes meeting criteria (FINAL_AC_MAG_00008)"
## [1] "7 genes meeting criteria (FINAL_AC_MAG_00028)"
## [1] "10 genes meeting criteria (FINAL_AD_MAG_00021)"
## [1] "FINAL_AD_MAG_00021 has no associated variability file..."
## [1] "0 genes meeting criteria (FINAL_AD_MAG_00015)"
## [1] "22 genes meeting criteria (FINAL_AH_MAG_00007)"
## [1] "12 genes meeting criteria (FINAL_AQ_MAG_00010)"
## [1] "3 genes meeting criteria (FINAL_AD_MAG_00004)"
## [1] "FINAL_AD_MAG_00004 has no associated variability file..."

synUnlinked10 <- codonSynonByMAG(MAG_list = unique(as.character(geneVsMAG$bin)), corMat = geneVsMAG, gene_info, gene_covs, bin_covs, corThresh = 0.418, greaterThan=F)

## [1] "41 genes meeting criteria (FINAL_AT_MAG_00012)"
## [1] "116 genes meeting criteria (FINAL_AJ_MAG_00005)"
## [1] "FINAL_AJ_MAG_00005 has no associated variability file..."
## [1] "111 genes meeting criteria (FINAL_AE_MAG_00012)"
## [1] "302 genes meeting criteria (FINAL_AC_MAG_00033)"
## [1] "FINAL_AC_MAG_00033 has no associated variability file..."
## [1] "377 genes meeting criteria (FINAL_AN_MAG_00021)"
## [1] "FINAL_AN_MAG_00021 has no associated variability file..."
## [1] "195 genes meeting criteria (FINAL_AD_MAG_00009)"
## [1] "103 genes meeting criteria (FINAL_AC_MAG_00020)"
## [1] "249 genes meeting criteria (FINAL_AE_MAG_00015)"
## [1] "30 genes meeting criteria (FINAL_AC_MAG_00006)"
## [1] "331 genes meeting criteria (FINAL_AQ_MAG_00003)"
## [1] "123 genes meeting criteria (FINAL_AD_MAG_00003)"
## [1] "233 genes meeting criteria (FINAL_AJ_MAG_00003)"
## [1] "351 genes meeting criteria (FINAL_AI_MAG_00002)"
## [1] "FINAL_AI_MAG_00002 has no associated variability file..."
## [1] "196 genes meeting criteria (FINAL_AR_MAG_00012)"
## [1] "FINAL_AR_MAG_00012 has no associated variability file..."
## [1] "503 genes meeting criteria (FINAL_AE_MAG_00007)"
## [1] "FINAL_AE_MAG_00007 has no associated variability file..."
## [1] "140 genes meeting criteria (FINAL_AJ_MAG_00008)"
## [1] "52 genes meeting criteria (FINAL_AC_MAG_00034)"
## [1] "FINAL_AC_MAG_00034 has no associated variability file..."
## [1] "37 genes meeting criteria (FINAL_AD_MAG_00002)"
## [1] "284 genes meeting criteria (FINAL_AC_MAG_00008)"
## [1] "196 genes meeting criteria (FINAL_AC_MAG_00028)"
## [1] "276 genes meeting criteria (FINAL_AD_MAG_00021)"
## [1] "FINAL_AD_MAG_00021 has no associated variability file..."
## [1] "5 genes meeting criteria (FINAL_AD_MAG_00015)"
## [1] "138 genes meeting criteria (FINAL_AH_MAG_00007)"
## [1] "76 genes meeting criteria (FINAL_AQ_MAG_00010)"
## [1] "159 genes meeting criteria (FINAL_AD_MAG_00004)"
## [1] "FINAL_AD_MAG_00004 has no associated variability file..."

synLinked90 <- codonSynonByMAG(MAG_list = unique(as.character(geneVsMAG$bin)), corMat = geneVsMAG, gene_info, gene_covs, bin_covs, corThresh = 0.985, greaterThan=T)

## [1] "1206 genes meeting criteria (FINAL_AT_MAG_00012)"
## [1] "118 genes meeting criteria (FINAL_AJ_MAG_00005)"
## [1] "FINAL_AJ_MAG_00005 has no associated variability file..."
## [1] "7 genes meeting criteria (FINAL_AE_MAG_00012)"
## [1] "79 genes meeting criteria (FINAL_AC_MAG_00033)"
## [1] "FINAL_AC_MAG_00033 has no associated variability file..."
## [1] "911 genes meeting criteria (FINAL_AN_MAG_00021)"
## [1] "FINAL_AN_MAG_00021 has no associated variability file..."
## [1] "83 genes meeting criteria (FINAL_AD_MAG_00009)"
## [1] "108 genes meeting criteria (FINAL_AC_MAG_00020)"
## [1] "No codon information for any of ^these genes"
## [1] "2 genes meeting criteria (FINAL_AE_MAG_00015)"
## [1] "No codon information for any of ^these genes"
## [1] "1 genes meeting criteria (FINAL_AC_MAG_00006)"
## [1] "No codon information for any of ^these genes"
## [1] "1 genes meeting criteria (FINAL_AQ_MAG_00003)"
## [1] "3 genes meeting criteria (FINAL_AD_MAG_00003)"
## [1] "2 genes meeting criteria (FINAL_AJ_MAG_00003)"
## [1] "7 genes meeting criteria (FINAL_AI_MAG_00002)"
## [1] "FINAL_AI_MAG_00002 has no associated variability file..."
## [1] "62 genes meeting criteria (FINAL_AR_MAG_00012)"
## [1] "FINAL_AR_MAG_00012 has no associated variability file..."
## [1] "0 genes meeting criteria (FINAL_AE_MAG_00007)"
## [1] "FINAL_AE_MAG_00007 has no associated variability file..."
## [1] "368 genes meeting criteria (FINAL_AJ_MAG_00008)"
## [1] "166 genes meeting criteria (FINAL_AC_MAG_00034)"
## [1] "FINAL_AC_MAG_00034 has no associated variability file..."
## [1] "437 genes meeting criteria (FINAL_AD_MAG_00002)"
## [1] "0 genes meeting criteria (FINAL_AC_MAG_00008)"
## [1] "2 genes meeting criteria (FINAL_AC_MAG_00028)"
## [1] "300 genes meeting criteria (FINAL_AD_MAG_00021)"
## [1] "FINAL_AD_MAG_00021 has no associated variability file..."
## [1] "235 genes meeting criteria (FINAL_AD_MAG_00015)"
## [1] "93 genes meeting criteria (FINAL_AH_MAG_00007)"
## [1] "478 genes meeting criteria (FINAL_AQ_MAG_00010)"
## [1] "115 genes meeting criteria (FINAL_AD_MAG_00004)"
## [1] "FINAL_AD_MAG_00004 has no associated variability file..."

synLinked99 <- codonSynonByMAG(MAG_list = unique(as.character(geneVsMAG$bin)), corMat = geneVsMAG, gene_info, gene_covs, bin_covs, corThresh = 0.997, greaterThan=T)

## [1] "293 genes meeting criteria (FINAL_AT_MAG_00012)"
## [1] "4 genes meeting criteria (FINAL_AJ_MAG_00005)"
## [1] "FINAL_AJ_MAG_00005 has no associated variability file..."
## [1] "0 genes meeting criteria (FINAL_AE_MAG_00012)"
## [1] "0 genes meeting criteria (FINAL_AC_MAG_00033)"
## [1] "FINAL_AC_MAG_00033 has no associated variability file..."
## [1] "61 genes meeting criteria (FINAL_AN_MAG_00021)"
## [1] "FINAL_AN_MAG_00021 has no associated variability file..."
## [1] "0 genes meeting criteria (FINAL_AD_MAG_00009)"
## [1] "0 genes meeting criteria (FINAL_AC_MAG_00020)"
## [1] "0 genes meeting criteria (FINAL_AE_MAG_00015)"
## [1] "0 genes meeting criteria (FINAL_AC_MAG_00006)"
## [1] "0 genes meeting criteria (FINAL_AQ_MAG_00003)"
## [1] "0 genes meeting criteria (FINAL_AD_MAG_00003)"
## [1] "0 genes meeting criteria (FINAL_AJ_MAG_00003)"
## [1] "0 genes meeting criteria (FINAL_AI_MAG_00002)"
## [1] "FINAL_AI_MAG_00002 has no associated variability file..."
## [1] "0 genes meeting criteria (FINAL_AR_MAG_00012)"
## [1] "FINAL_AR_MAG_00012 has no associated variability file..."
## [1] "0 genes meeting criteria (FINAL_AE_MAG_00007)"
## [1] "FINAL_AE_MAG_00007 has no associated variability file..."
## [1] "0 genes meeting criteria (FINAL_AJ_MAG_00008)"
## [1] "1 genes meeting criteria (FINAL_AC_MAG_00034)"
## [1] "FINAL_AC_MAG_00034 has no associated variability file..."
## [1] "43 genes meeting criteria (FINAL_AD_MAG_00002)"
## [1] "0 genes meeting criteria (FINAL_AC_MAG_00008)"
## [1] "0 genes meeting criteria (FINAL_AC_MAG_00028)"
## [1] "0 genes meeting criteria (FINAL_AD_MAG_00021)"
## [1] "FINAL_AD_MAG_00021 has no associated variability file..."
## [1] "0 genes meeting criteria (FINAL_AD_MAG_00015)"
## [1] "1 genes meeting criteria (FINAL_AH_MAG_00007)"
## [1] "No codon information for any of ^these genes"
## [1] "169 genes meeting criteria (FINAL_AQ_MAG_00010)"
## [1] "0 genes meeting criteria (FINAL_AD_MAG_00004)"
## [1] "FINAL_AD_MAG_00004 has no associated variability file..."

plot_syn <- rbind(cbind(synUnlinked10, type="Bottom 10%"), cbind(synLinked90, type="Top 10%"),
                  cbind(synUnlinked01, type="Bottom 1%"), cbind(synLinked99, type='Top 1%'))
plot_syn <- plot_syn[!is.na(plot_syn$synonymity),]
plot_syn$gene <- factor(plot_syn$gene)

ggplot(plot_syn, aes(x=type, y = synonymity, fill=type, color=type)) +
  geom_point(data=group_by(plot_syn, type) %>% sample_n(1000), size=0.4, alpha=0.5, position=position_jitter(width=0.3, height=0)) +
  geom_violin(alpha=0.6) +
  labs(fill="Percentile", x = "Percentile of gene pairwise correlations", y= "Synonymity") +
  scale_fill_manual(values = brewer.pal(name='BrBG', n=4)[c(1,4,2,3)]) + scale_color_manual(values = brewer.pal(name='BrBG', n=4)[c(1,4,2,3)], guide=F) +
  theme_basic
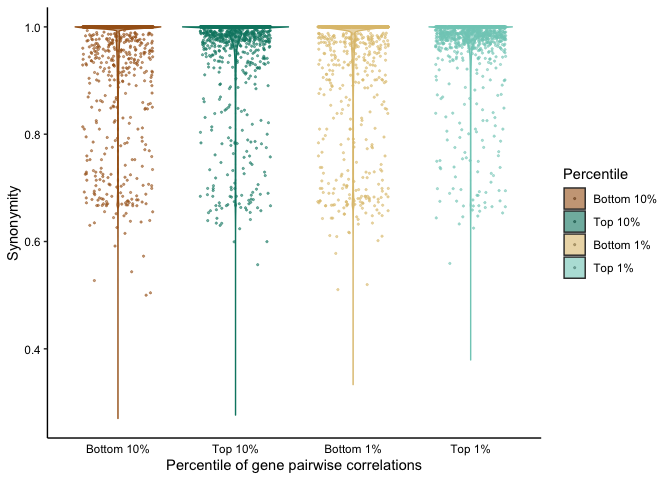
wilcox.test(x=plot_syn$synonymity[plot_syn$type == "Bottom 10%"], y=plot_syn$synonymity[plot_syn$type == "Top 10%"])

##
##  Wilcoxon rank sum test with continuity correction
##
## data:  plot_syn$synonymity[plot_syn$type == "Bottom 10%"] and plot_syn$synonymity[plot_syn$type == "Top 10%"]
## W = 3.6391e+11, p-value < 2.2e-16
## alternative hypothesis: true location shift is not equal to 0

wilcox.test(x=plot_syn$synonymity[plot_syn$type == "Bottom 1%"], y=plot_syn$synonymity[plot_syn$type == "Top 1%"])

##
##  Wilcoxon rank sum test with continuity correction
##
## data:  plot_syn$synonymity[plot_syn$type == "Bottom 1%"] and plot_syn$synonymity[plot_syn$type == "Top 1%"]
## W = 4053762338, p-value < 2.2e-16
## alternative hypothesis: true location shift is not equal to 0
Some functions specific for Fig 4B:
fetchVariabilityCDNForMAG <- function(MAG="FINAL_AD_MAG_00009", focalGenes, minCov=10) {
  codonVar <- read.csv(paste0("catalyst_idba/codon_var/", MAG, "-var-CDN.tsv"), sep="\t")

  codonVar <- codonVar[codonVar$coverage >= minCov,]

  codonVar <- codonVar[codonVar$corresponding_gene_call %in% focalGenes,]

  codonVar[,grep("^...$",colnames(codonVar))] <- t(apply(codonVar[,grep("^...$",colnames(codonVar))], 1, function(x) x/sum(x)))

  codonVar <- melt(codonVar, measure.vars = grep("^...$",colnames(codonVar)), variable.name = "codon", value.name = "codon_count")

  codonVar$Day <- gsub("A[A-Z]","", as.character(codonVar$sample_id))
  codonVar$Day <- factor(codonVar$Day, levels = mixedsort(unique(as.character(codonVar$Day))))  # sort human
  codonVar$Participant <- gsub("(A[A-Z]).*$","\\1",as.character(codonVar$sample_id))

  return(codonVar)
}

traceGenesByMAGwithSyn <- function(infoDF, covDF, binDF, bin, statsDF, focusGenes = "164483", codonPos="208", minGeneCov=0, tax=makegtdbtktaxMat(), proportional=T, facetGrid=T,
                                   sqrt_transform=F, log10_transform=F) {
  if (is.null(focusGenes)){
    covDF <- covDF[covDF$key %in% infoDF[infoDF$bin == bin,"gene_callers_id"],]  # get coverages for this MAG

    print(paste0(nrow(covDF), " genes in ", bin))
  } else {
    covDF <- covDF[covDF$key %in% focusGenes,]
  }

  # get overall coverage for MAGs
  binTrace <- setNames(as.numeric(binDF[binDF$bins == bin, grep("A", colnames(binDF))]), grep("A", colnames(binDF), value = T))
  binTrace <- binTrace[mixedorder(names(binTrace))]  # sort human (e.g. AB1 comes before AB15 before AB2)

  codonVar <- fetchVariabilityCDNForGenes(genes = focusGenes, geneInfo = infoDF)

  if (proportional){
    codonVar[,grep("^...$",colnames(codonVar))] <- t(apply(codonVar[,grep("^...$",colnames(codonVar))], 1, function(x) x/sum(x)))
  }

  codonVar <- melt(codonVar, measure.vars = grep("^...$",colnames(codonVar)), variable.name = "codon", value.name = "codon_count")

  # make long for ggplotting
  covDF <- melt(covDF, id.vars = 'key')
  colnames(covDF) <- c('Gene','Sample','Coverage')

  # order things nicely and make participant
  covDF$Gene <- factor(covDF$Gene)
  covDF$Day <- gsub("A[A-Z]","", as.character(covDF$Sample))
  covDF$Day <- factor(covDF$Day, levels = mixedsort(unique(as.character(covDF$Day))))  # sort human
  covDF$Participant <- gsub("(A[A-Z]).*$","\\1",as.character(covDF$Sample))

  codonVar$Day <- gsub("A[A-Z]","", as.character(codonVar$sample_id))
  codonVar$Day <- factor(codonVar$Day, levels = mixedsort(unique(as.character(codonVar$Day))))  # sort human
  codonVar$Participant <- gsub("(A[A-Z]).*$","\\1",as.character(codonVar$sample_id))


  # grab genes above threshold
  geneThresh <- ddply(covDF, ~ Gene + Participant, summarise, meanCov = mean(Coverage)) %>% filter(meanCov >= minGeneCov) %>% pull(Gene)
  covDF <- covDF[covDF$Gene %in% unique(geneThresh),]

  # make a little dataframe to facilitate overlaying the bin's coverage
  binCov <- data.frame(Sample=factor(gsub("A[A-Z]","",names(binTrace)), levels = unique(gsub("A[A-Z]","",names(binTrace)))), Coverage=binTrace,
                       Participant = gsub("(A[A-Z]).*$","\\1",names(binTrace)))

  codonVar <- codonVar[codonVar$codon_number %in% c(codonPos),]
  codonVar <- codonVar[codonVar$codon_count > 0,]

  covDF$codon_count <- covDF$Coverage
  binCov$codon_count <- binCov$Coverage

  # dummy category for y facet
  covDF$category <- "higher"
  binCov$category <- "higher"
  codonVar$category <- "lower"

  p <- ggplot(codonVar, aes(x = Day, y = codon_count)) +
      facet_grid(category~Participant, scales='free', space='free_x') +
      geom_line(data=covDF[covDF$Participant %in% codonVar$Participant,], aes(y=codon_count, x=Day, group=Gene), color='grey50', size = 0.8) +
      geom_line(data = binCov[binCov$Participant %in% codonVar$Participant,], aes(group = Participant, x=Sample), size = 1, color = 'black') +
      geom_col(aes(fill=codon), color='black') +
      geom_label(data=codonVar %>% group_by(Day, Participant, synonymity, category) %>% summarise(codon_count=sum(codon_count)),
                 aes(label=round(synonymity,2), y=codon_count -0.25), size=2.5, label.padding = unit(0.15,'lines')) +
      scale_y_continuous(expand = c(0,0)) + scale_x_discrete(expand = c(0,0.5)) + labs(x="Sample Day", y='Variant frequency', fill='Codon') + scale_fill_discrete(drop=T) +
      labs(title=bin, subtitle = paste0(paste0(as.character(as.matrix(tax[tax$MAG == bin, c("Genus","Species")])), collapse = " "),  # this is "Genus sp."
                                        ": ",round(statsDF$completion[statsDF$MAG == bin],1), "% C / ", round(statsDF$redundancy[statsDF$MAG == bin], 1), "% R, ",
                                        round(statsDF$length[statsDF$MAG == bin]/1e6, 2), " Mb")) + guides(color=F) +
      theme_basic + theme(strip.background = element_blank(), strip.text.y = element_blank(), strip.background.x = element_blank(), panel.spacing = unit(0.2, 'lines'))

  print(p)
}
These functions were used to produce Figure 4B
traceGenesByMAGwithSyn(gene_info, gene_covs, bin_covs, bin="FINAL_AD_MAG_00009",statsDF = bin_stats, sqrt_transform = T, focusGenes = "164483", codonPos="208")

## `summarise()` regrouping output by 'Day', 'Participant', 'synonymity' (override with `.groups` argument)
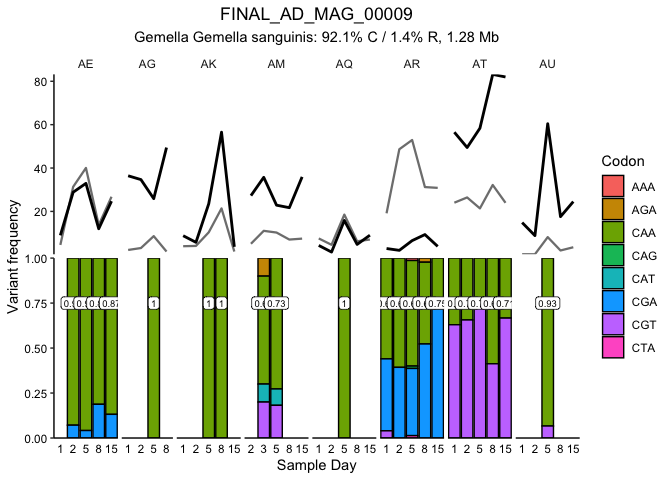
And the two callouts in Figure 4C:
traceGenesByMAGwithSyn(gene_info, gene_covs, bin_covs, bin="FINAL_AE_MAG_00012",statsDF = bin_stats, sqrt_transform = T, focusGenes = "205006", codonPos="580")

## `summarise()` regrouping output by 'Day', 'Participant', 'synonymity' (override with `.groups` argument)
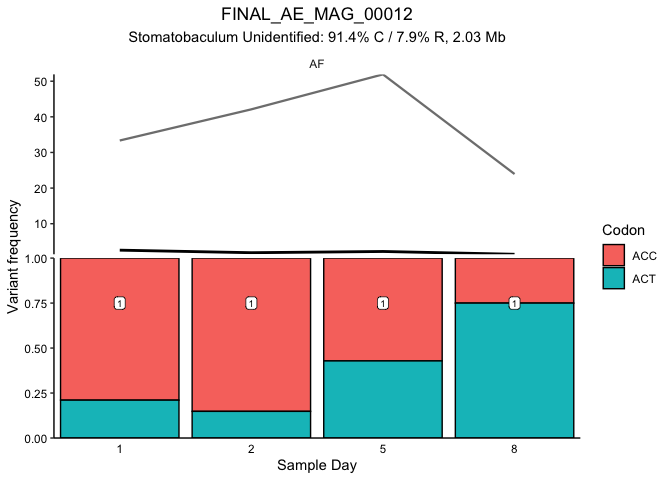
traceGenesByMAGwithSyn(gene_info, gene_covs, bin_covs, bin="FINAL_AQ_MAG_00003",statsDF = bin_stats, sqrt_transform = T, focusGenes = "581326", codonPos="59")

## `summarise()` regrouping output by 'Day', 'Participant', 'synonymity' (override with `.groups` argument)
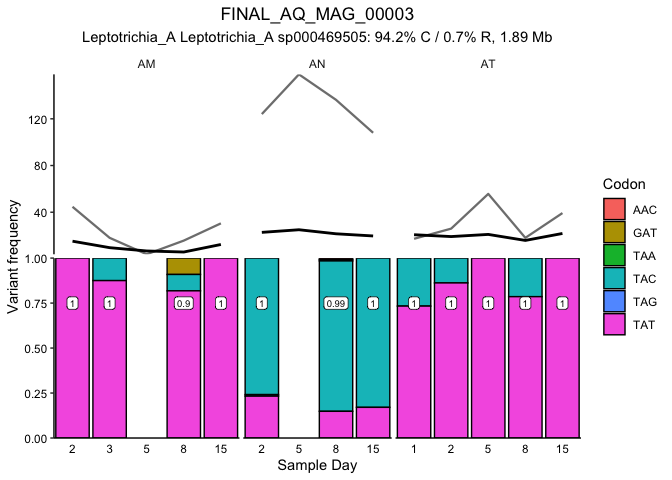
Figure 4C:
magList <- unique(as.character(synUnlinked01$MAG))
for (mag in magList) {
  df <- fetchVariabilityCDNForMAG(MAG=mag, focalGenes = unique(as.character(synUnlinked01$gene[synUnlinked01$MAG == mag])), minCov=10)
  df <- df %>% group_by(unique_pos_identifier, corresponding_gene_call, Participant, codon) %>% filter(n()>=4 & any(codon_count > 0))

  if (nrow(df) < 4) {
    next()
  }
  df <- df %>% summarise(lmCoef = lm(codon_count~as.numeric(Day))$coefficients[2], meanSyn = mean(synonymity, na.rm = T))
  df <- data.frame(df)
  df$MAG <- mag
  if (mag == magList[1]) {
    codonTrend <- df
  } else {
    codonTrend <- rbind(codonTrend, data.frame(df))
  }
}

codonTrend$quantile <- cut(codonTrend$lmCoef, c(-Inf, quantile(codonTrend$lmCoef, c(0.01,.99)), Inf), labels = c('2%','98%','2%'))

codonTrend$MAG <- factor(gsub("(^.*)(MAG_)(.*$)","\\2\\1\\3", gsub("_000","_", gsub("FINAL_","",as.character(codonTrend$MAG)))))

ggplot(codonTrend, aes(x=factor(corresponding_gene_call), y = lmCoef)) +
  facet_grid(.~MAG, scales = 'free_x', space = 'free_x') +
  geom_hline(yintercept = quantile(codonTrend$lmCoef, 0.99), lty=2) +
  geom_hline(yintercept = quantile(codonTrend$lmCoef, 0.01), lty=2) +
  geom_point(aes(color=quantile), position = position_jitter(height = 0, width = 0.2), alpha=0.4, pch=16) +
  geom_violin(fill=NA, alpha=0.4, color='#00000066') +
  labs(x="Genes", y="Slope of codon proportion over time in a mouth") +
  scale_color_manual(values = c('darkred','steelblue3')) +
  theme_classic() + theme(axis.text.x = element_blank())
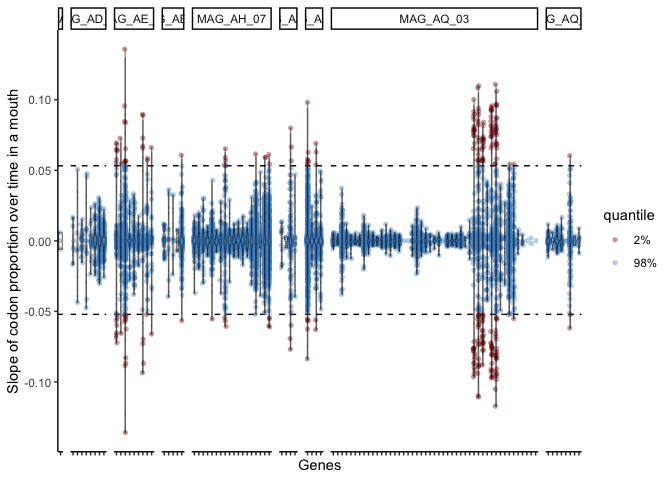
Figure 4D:
ggplot(codonTrend, aes(x=lmCoef, y=meanSyn, color=quantile)) +
  geom_point(alpha=0.4, pch=16) +
  labs(x="Slope of codon proportion over time in a mouth", y = "Average synonymity") +
  scale_color_manual(values = c('darkred','steelblue3')) +
  theme_classic() + theme(panel.spacing = unit(0.2, 'line'))