Actinomyces comparative genomics
Overview
This is a narrative methods providing a reproducible workflow of the analyses used in our paper The saccharibacterium TM7x elicits differential responses across its host range. In this paper, we describe how we found that Nanosynbacter lyticus TM7x can establish an ectosymbiotic relationship on several related Actinomyces spp., but the inital relationship differs among the susceptible strains. That is, TM7x behaves like a parasite with A. odontolyticus XH001 in the lab, documented here, where naive XH001 experience a strong crash in growth upon exposure to TM7x, and after a few passages they regain balance and achieve a stable relationship with TM7x. However, not all Actinomyces strains that could host TM7x had this crash. Specifically, out of 13 susceptible Actinomyces strains spanning ~74% AAI and two named species, three strains never crashed in response to TM7x, regardless of the initial TM7x dosage. This observation is exciting, as it suggests that across a moderate host range, the nature of the symbiosis, e.g., parasitism, might not be the same across all potential hosts. But further, since we have genomes for the majority of these strains, we might glean some some insights into what makes A. spp. able to host TM7x or why some strains are negatively vs. neutrally affected by hosting TM7x.
First we manually downloaded genomes from NCBI corresponding to the 23 strains we characterized experimentally. For convenience here are their names:
A_odontolyticus_ATCC_17929
A_odontolyticus_ATCC_17982
A_meyeri_ATCC_35568
A_odontolyticus_F0309
A_sp_HMT_180_F0310
A_sp_HMT_172_F0311
A_sp_HMT_849_F0330
A_sp_HMT_848_F0332
A_sp_HMT_171_F0337
A_sp_HMT_178_F0338
A_sp_HMT_175_F0384
A_sp_HMT_170_F0386
A_sp_HMT_448_F0400
A_massiliensis_F0489
A_johnsonii_F0510
A_graevenitzii_F0530
A_sp_HMT_877_F0543
A_sp_HMT_414_F0588
A_sp_ICM39
A_sp_ICM47
A_sp_ICM58
A_meyeri_W712
A_odontolyticus_XH001
While collecting the genomes, we changed each fasta’s defline to be like
>A_meyeri_W712_ctg1 from the more complicated default NCBI header.
There are many ways to do this but we did it like
awk '/>/ {print ">A_meyeri_W712_ctg" i++} !/>/ {print $0}' A_W712.fasta > A_W712-renamed.fasta.
The original genomes went into a directory called original_genomes and
the renamed files into genomes.
Side note: We ran all of these analyses on an 8-core 2019 MacBook Pro with 32GB RAM, except for the functional annotation with Interproscan, which we ran on Harvard University’s Odyssey cluster to make that step faster. This cluster uses the Slurm job scheduler; we have included the header information for the sake of repeatability and to provide context about the resources used and the means of parallelization.
Pangenome construction
To relate the genomes based on gene content and investigate potentially shared distinctive features, we made a pangenome. We used anvi’o, a framework for analysis and visualization of ’omics data, for the majority of this project.
First we added all our genomes’ contigs (contiguous chunks) into a
single contigs database. First we combined all the renamed fastas, like
cat genomes/*renamed.fasta > Actinomyces-23.fa. Then we converted this
to an anvi’o contigs database with
anvi-gen-contigs-database -f Actinomyces-23.fa -o Actinomyces-23-CONTIGS.db
During this step, anvi’o invoked Prodigal to call genes on our contigs.
Annotating gene calls
The predicted genes were then annotated using Interproscan that is a useful bundle of a variety of annotation sources like Pfam and Tigrfam. To annotate the genomes rather quickly, we parallelized the process by choping the job up into multiple batches which ran concurrently on our university’s cluster. To get the gene sequences (amino acid), we ran
anvi-get-sequences-for-gene-calls -c Actinomyces-23-CONTIGS.db --wrap 0 --get-aa-sequences -o Actinomyces-23-gene-calls.faa
This was chopped up into chunks of 5000 genes apiece by
split -l 10000 -d -a 4 Actinomyces-23-gene-calls.faa Actinomyces-23-gene-calls.faa-
and then we set up the column names of the output table with
echo -e "gene_callers_id\tsource\taccession\tfunction\te_value" > interpro-results-formatted-Actinomyces-23.tsv
The split command generated 11 files starting of the form
PREFIX.faa-BATCH (e.g. Actinomyces-23-gene-calls.faa-0004), which
fed into the following Slurm job array script:
#!/bin/bash
#SBATCH -N 1 #1 nodes of ram
#SBATCH -n 12 # 12 cores from each
#SBATCH --contiguous
#SBATCH --mem=12G #per node
#SBATCH -t 0-6:00:00
#SBATCH -p shared
#SBATCH --array=0-10%11
#SBATCH --job-name="anvi-ipAct"
#SBATCH -o odyssey_anviIPact.out
#SBATCH -e odyssey_anviIPact.err
#SBATCH --mail-type=END

# set this up first
# split -l 10000 -d -a 4 Actinomyces-23-gene-calls.faa Actinomyces-23-gene-calls.faa-
# echo -e "gene_callers_id\tsource\taccession\tfunction\te_value" > interpro-results-formatted-Actinomyces-23.tsv


prefix="Actinomyces-23"
taskNum=$(printf %04d $SLURM_ARRAY_TASK_ID)  # format slurm task id to be padded with 0s like split

# identify which batch this array element matches
batch=$prefix-gene-calls.faa-$taskNum

# load java for interproscan
module load jdk/1.8.0_172-fasrc01

# run interproscan on this batch
./../../interproscan-sh/interproscan-5.36-75.0/interproscan.sh -i $batch -o ${batch}.tsv -f tsv --appl TIGRFAM,Pfam,SUPERFAMILY,ProDom,Gene3D

# format it manually and append to main table
cat ${batch}.tsv | awk -F"\t" '{print $1 FS $4 FS $5 FS $6 FS $9}' >> interpro-results-formatted-$prefix.tsv
Once this finished, we imported the results into the contigs database
with
anvi-import-functions -c Actinomyces-23-CONTIGS.db -i interpro-results-formatted-Actinomyces-23.tsv
We also ran HMM profiles for a custom set of canonically single copy
core genes anvi’o knows about, with
anvi-run-hmms -c Actinomyces-23-CONTIGS.db -T 8 (the -T 8 used 8
threads to speed things up). From this information anvi’o will later be
able to estimate each genome’s completeness and redundancy, based on the
number of single copy core genes missing or duplicated, respectively.
Then we made a dummy profile collection since that is required for the next step by anvi’o, like so:
anvi-profile --blank-profile -c Actinomyces-23-CONTIGS.db -o Actinomyces-23-PROFILE -S dummy
The main purpose of this is to hold a ‘collection’ that tells anvi’o which contigs came from which genome. To do this anvi’o needs a file with two columns where the left column is the contig name and right column is the collection name (here, genome name) to which that contig belongs.
We accomplished this with a quick bash oneliner to trim off the _ctg#
suffix from the contig deflines, like
awk -F"_ctg" '/>/ {print $0 "\t" $1}' Actinomyces-23.fa | sed 's/>//g' > collection_mapper_Actinomyces-23.txt
Then we can move the profile database to an convenient place like
mv Actinomyces-23-PROFILE/PROFILE.db Actinomyces-23-PROFILE.db, then
import the file into the PROFILE db to associate the contigs into
genomes:
anvi-import-collection -p Actinomyces-23-PROFILE.db -c Actinomyces-23-CONTIGS.db -C Genomes collection_mapper_Actinomyces-23.txt --contigs-mode
With this information in hand we can then write a file that contains all
the info for how to identify each genome and where to find its data,
which we call Actinomyces-23-internal-genomes-table.txt whose contents
are copied here for convenience:
name    bin_id  collection_id   profile_db_path contigs_db_path
A_odontolyticus_ATCC_17929  A_odontolyticus_ATCC_17929  Genomes Actinomyces-23-PROFILE.db   Actinomyces-23-CONTIGS.db
A_odontolyticus_ATCC_17982  A_odontolyticus_ATCC_17982  Genomes Actinomyces-23-PROFILE.db   Actinomyces-23-CONTIGS.db
A_meyeri_ATCC_35568 A_meyeri_ATCC_35568 Genomes Actinomyces-23-PROFILE.db   Actinomyces-23-CONTIGS.db
A_odontolyticus_F0309   A_odontolyticus_F0309   Genomes Actinomyces-23-PROFILE.db   Actinomyces-23-CONTIGS.db
A_sp_HMT_180_F0310  A_sp_HMT_180_F0310  Genomes Actinomyces-23-PROFILE.db   Actinomyces-23-CONTIGS.db
A_sp_HMT_172_F0311  A_sp_HMT_172_F0311  Genomes Actinomyces-23-PROFILE.db   Actinomyces-23-CONTIGS.db
A_sp_HMT_849_F0330  A_sp_HMT_849_F0330  Genomes Actinomyces-23-PROFILE.db   Actinomyces-23-CONTIGS.db
A_sp_HMT_848_F0332  A_sp_HMT_848_F0332  Genomes Actinomyces-23-PROFILE.db   Actinomyces-23-CONTIGS.db
A_sp_HMT_171_F0337  A_sp_HMT_171_F0337  Genomes Actinomyces-23-PROFILE.db   Actinomyces-23-CONTIGS.db
A_sp_HMT_178_F0338  A_sp_HMT_178_F0338  Genomes Actinomyces-23-PROFILE.db   Actinomyces-23-CONTIGS.db
A_sp_HMT_175_F0384  A_sp_HMT_175_F0384  Genomes Actinomyces-23-PROFILE.db   Actinomyces-23-CONTIGS.db
A_sp_HMT_170_F0386  A_sp_HMT_170_F0386  Genomes Actinomyces-23-PROFILE.db   Actinomyces-23-CONTIGS.db
A_sp_HMT_448_F0400  A_sp_HMT_448_F0400  Genomes Actinomyces-23-PROFILE.db   Actinomyces-23-CONTIGS.db
A_massiliensis_F0489    A_massiliensis_F0489    Genomes Actinomyces-23-PROFILE.db   Actinomyces-23-CONTIGS.db
A_johnsonii_F0510   A_johnsonii_F0510   Genomes Actinomyces-23-PROFILE.db   Actinomyces-23-CONTIGS.db
A_graevenitzii_F0530    A_graevenitzii_F0530    Genomes Actinomyces-23-PROFILE.db   Actinomyces-23-CONTIGS.db
A_sp_HMT_877_F0543  A_sp_HMT_877_F0543  Genomes Actinomyces-23-PROFILE.db   Actinomyces-23-CONTIGS.db
A_sp_HMT_414_F0588  A_sp_HMT_414_F0588  Genomes Actinomyces-23-PROFILE.db   Actinomyces-23-CONTIGS.db
A_sp_ICM39  A_sp_ICM39  Genomes Actinomyces-23-PROFILE.db   Actinomyces-23-CONTIGS.db
A_sp_ICM47  A_sp_ICM47  Genomes Actinomyces-23-PROFILE.db   Actinomyces-23-CONTIGS.db
A_sp_ICM58  A_sp_ICM58  Genomes Actinomyces-23-PROFILE.db   Actinomyces-23-CONTIGS.db
A_meyeri_W712   A_meyeri_W712   Genomes Actinomyces-23-PROFILE.db   Actinomyces-23-CONTIGS.db
A_odontolyticus_XH001   A_odontolyticus_XH001   Genomes Actinomyces-23-PROFILE.db   Actinomyces-23-CONTIGS.db
Now we can pull the relevant information for these genomes using the following anvi’o command:
anvi-gen-genomes-storage -i Actinomyces-23-internal-genomes-table.txt -o Actinomyces-23-GENOMES.db
And then use the resultant GENOMES.db file to calculate the pangenome:
anvi-pan-genome -g Actinomyces-23-GENOMES.db -o Actinomyces-23-PAN -n Actinomyces-23-mcl6 --mcl-inflation 6 --use-ncbi-blast -T 10
This step is where we operationally define gene homology. To do this,
anvi’o first uses blastp (--use-ncbi-blast) to compute the amino acid
similarities between each pair of genes (technically, predicted ORFs).
Then, the blastp similarities are used to generate a network linking
genes, where edges are blastp similarities and nodes are genes.
MCL, a network clustering algorithm, is then
applied to this network to identify ‘clusters’ of genes on the graph,
that represent genes clustered together in amino-acid space. These
operationally defined gene homologs are so called gene clusters. The
tendency of MCL to split or lump clusters is based on the hyperparameter
--mcl-inflation which we set to 6, as that has produced good results
for genus-level pangenomes.
Adding some miscellaneous data
Once the pangenome was done, we imported information about the number of
contigs and the TM7x susceptibility of each genome. We found the number
of contigs for each genome by running
awk '{print $2}' collection_mapper_Actinomyces-23.txt | uniq -c and
then manually adding the corresponding TM7x information from the wet
experiments. This resulted in the following table:
layer   Hosting NumCtgs
A_odontolyticus_ATCC_17929  Crash   26
A_odontolyticus_ATCC_17982  Crash   2
A_meyeri_ATCC_35568 Crash   15
A_odontolyticus_F0309   Crash   6
A_sp_HMT_180_F0310  Crash   6
A_sp_HMT_172_F0311  No_crash    215
A_sp_HMT_849_F0330  Resistant   76
A_sp_HMT_848_F0332  Resistant   1
A_sp_HMT_171_F0337  Resistant   280
A_sp_HMT_178_F0338  Crash   43
A_sp_HMT_175_F0384  Resistant   7
A_sp_HMT_170_F0386  Resistant   76
A_sp_HMT_448_F0400  Resistant   12
A_massiliensis_F0489    Resistant   233
A_johnsonii_F0510   Resistant   324
A_graevenitzii_F0530    Resistant   29
A_sp_HMT_877_F0543  Crash   1
A_sp_HMT_414_F0588  Resistant   1
A_sp_ICM39  Crash   146
A_sp_ICM47  No_crash    143
A_sp_ICM58  No_crash    1
A_meyeri_W712   Crash   1
A_odontolyticus_XH001   Crash   5
This was imported into the pangenome for visual display with
anvi-import-misc-data -p Actinomyces-23-PAN/Actinomyces-23-mcl6-PAN.db -t layers Actinomyces-23-external-table.txt
We also converted the susceptibility information to a numeric variable (resistant=0, No_crash=0.5, Crash=1) and similarly imported it.
Altogether, this generated the pangenome displayed in Figure 5, when colored and formatted, and the genomes are oriented by gene cluster frequencies.
Enriched functions
Based on the layout in the pangenome and the gene cluster that were visibly core to each group, we wondered if we could identify functions enriched in each group. To that end, we applied a built-in function in anvi’o that ultimately compares genomes based on what predicted functions they share or don’t share, rather than specific homologs (as is displayed in the pangenome) (Shaiber et al., submitted). This method works by passing anvi’o a list of which genomes belong in which category, a functional annotation (here, Pfam), and then anvi’o counts up, for each function, the number of genomes by category. From this, a table is made that lists each function, its ‘enrichment score’ reflecting the ratio of in- vs. out-of-category genomes having that predicted function, a p-value and FDR-adjusted q-value, and the proportion of genomes in each category containing that function (so we biologists can decide whether we believe the machine’s estimate of significant enrichment). All this is done with the following command:
anvi-get-enriched-functions-per-pan-group -p Actinomyces-23-PAN/Actinomyces-23-mcl6-PAN.db -g Actinomyces-23-GENOMES.db --category Hosting --annotation-source Pfam -o Actinomyces-23-ENRICHED-PFAM.txt
This generated Table S4 of the manuscript, from which the top genes in relevant categories were taken to report in the in-text Table 1.
Investigating single-gene trees from core gene clusters
While presence/absence of gene clusters or functions may distinguish features of Actinomyces strains important determining TM7x response, this method assumes that the phenotype is based on the complete presence or absence of a gene/function. However, it is biologically plausible (and evident in many host/phage systems) that a conserved gene may be the target, in which case seemingly minor amino-acid sequence variants can effect a strong change in the host/symbiont relationship. To address this second scenario, we decided to look for amino acid sequence variants in gene clusters core to all 23 genomes, or core to the 13 genomes that could host TM7x. Specifically, we looked for variants that distinguished the various groups (e.g. non-crashers vs crashers vs resistant).
Extracting genes and generating gene trees
So first we exported all gene clusters that were present in all 23 or
the 13 TM7x-hosting genomes, but only gene clusters represented by a
single gene sequence per genome. We accomplished that by first
summarizing the pangenome so that we record in the pangenome database
which gene clusters occur in which core sets (e.g. core to all genomes,
core to resistant, etc):
anvi-summarize -g Actinomyces-23-GENOMES.db -p Actinomyces-23-PAN/Actinomyces-23-mcl6-PAN.db -C cores -o Actinomyces-23-SUMMARY
followed by
gunzip Actinomyces-23-SUMMARY/Actinomyces-23-mcl6_gene_clusters_summary.txt.gz
And the resultant *summary.txt file contains information for all gene
clusters and genomes in the pangenome, which is Table S3 in the
manuscript.
We then pulled out the gene clusters of interest:
for gc in $(grep 'Susceptible_core' Actinomyces-23-SUMMARY/Actinomyces-23-mcl6_gene_clusters_summary.txt | awk -F"\t" '{print $2}' | uniq); do

anvi-get-sequences-for-gene-clusters -p Actinomyces-23-PAN/Actinomyces-23-mcl6-PAN.db -g Actinomyces-23-GENOMES.db \
--max-num-genes-from-each-genome 1 --gene-cluster-id $gc -o susceptible_core_gcs/$gc.faa

done
And
for gc in $(grep 'All_core' Actinomyces-23-SUMMARY/Actinomyces-23-mcl6_gene_clusters_summary.txt | awk -F"\t" '{print $2}' | uniq); do

anvi-get-sequences-for-gene-clusters -p Actinomyces-23-PAN/Actinomyces-23-mcl6-PAN.db -g Actinomyces-23-GENOMES.db \
--max-num-genes-from-each-genome 1 --gene-cluster-id $gc -o all_core_gcs/$gc.faa

done
This identified and saved alignments for 419 gene clusters for the 13 susceptible strains and 291 gene clusters for all 23 genomes.
The deflines contained more information than we wanted in the tip labels
so we simplified with sed -i "" 's/>.*genome_name:/>/; s/|.*$//' *faa
Then we generated phylogenies with
FastTree
for each gene with for gc in $(ls); do FastTree $gc > $gc.nwk; done
which produced a newick tree for each gene cluster.
Identifying gene clusters producing interesting topologies
Now that we had all these gene trees, we screened through them quickly with a custom python script:
from ete3 import Tree
import glob
from itertools import combinations
import re
import pandas as pd

# this is the dendrogram produced by gene cluster frequency in pangenome in Fig 5, also cartoonized in Fig 6a
refAll = Tree("(((A_sp_HMT_848_F0332,A_graevenitzii_F0530),(((A_sp_HMT_448_F0400,A_massiliensis_F0489),\
A_sp_HMT_414_F0588),(((A_sp_HMT_175_F0384,A_sp_HMT_171_F0337),A_sp_HMT_170_F0386),\
(A_sp_HMT_849_F0330,A_johnsonii_F0510)))),(((((A_sp_ICM58,A_sp_HMT_172_F0311),A_sp_ICM47),\
((((A_odontolyticus_F0309,A_odontolyticus_ATCC_17982),A_odontolyticus_ATCC_17929),A_sp_HMT_180_F0310),\
(A_sp_ICM39,A_odontolyticus_XH001))),(A_meyeri_W712,A_meyeri_ATCC_35568)),(A_sp_HMT_877_F0543,A_sp_HMT_178_F0338)));")

# Define tips belonging to the various clades
noCrashClade = ['A_sp_ICM58', 'A_sp_HMT_172_F0311', 'A_sp_ICM47']
crashersInternal = ['A_odontolyticus_F0309','A_odontolyticus_ATCC_17982','A_odontolyticus_ATCC_17929',
                    'A_sp_HMT_180_F0310','A_sp_ICM39','A_odontolyticus_XH001']
crashersPolyphyletic = ['A_meyeri_W712','A_meyeri_ATCC_35568','A_sp_HMT_877_F0543','A_sp_HMT_178_F0338']
resistant = ['A_sp_HMT_848_F0332','A_graevenitzii_F0530','A_sp_HMT_448_F0400','A_massiliensis_F0489',
             'A_sp_HMT_414_F0588','A_sp_HMT_175_F0384','A_sp_HMT_171_F0337','A_sp_HMT_170_F0386','A_sp_HMT_849_F0330',
             'A_johnsonii_F0510']

comparisons = {}  # to save a record matching gene clusters with their type of topology
usefulTrees = {}  # to save the associated trees

# For the 23 core set
for path in glob.glob("/Users/dutter/g4/bat_tm7/core_gene_clusters/*nwk"):

    t = Tree(path) # read tree
    # Course check for whether non-crashers and resistant are each monophyletic
    if t.check_monophyly(values=noCrashClade, target_attr='name')[0] and \
            t.check_monophyly(values=resistant, target_attr='name')[0]:

        # extract the gene cluster ID from the filename
        gene_cluster_id = re.sub(r"^.*/(.*).faa.nwk", '\\1', path)

        # Now check ideal case - non-crashers are sister to resistant, together sister to the crashers - Fig 6c
        if t.check_monophyly(values=noCrashClade + resistant, target_attr='name')[0] and \
                t.check_monophyly(values=crashersInternal, target_attr='name')[0]:
            comparisons[gene_cluster_id] = '(((noCrash) + (resistant)) + (most_crashers))'
            usefulTrees[gene_cluster_id] = t

        # but also interested if all three groups are monophyletic but we don't specify the relationship between them - Fig 6b
        elif any([t.check_monophyly(values=crashersInternal + list(combo), target_attr='name')[0]
                  for length in [0, 1, 2, 3, 4] for combo in combinations(crashersPolyphyletic, length)]):
            comparisons[gene_cluster_id]='no_crash, resistant, most non_crashers each monophyletic but variably related'
            usefulTrees[gene_cluster_id] = t


# do likewise for the gene clusters core to 13 susceptible genomes - Fig 6d
for path in glob.glob("/Users/dutter/g4/bat_tm7/susceptible_core_gcs/*nwk"):

    t = Tree(path)  # read tree in

    # no resistant genomes so only check if non-crashers and the odontolyticus group of 6 genomes are each monophyletic regardless of relationship
    if t.check_monophyly(values=noCrashClade, target_attr='name')[0] and \
            any([t.check_monophyly(values=crashersInternal + list(combo), target_attr='name')[0]
                 for length in [0, 1, 2, 3, 4] for combo in combinations(crashersPolyphyletic, length)]):

        # extract the gene cluster ID from the filename
        gene_cluster_id = re.sub(r"^.*/(.*).faa.nwk", '\\1', path)  # extract

        comparisons[gene_cluster_id] = '(noCrash) + (most_crashers)'
        usefulTrees[gene_cluster_id] = t


# read in the gene cluster summary information to get functions
pan = pd.read_csv("~/g4/bat_tm7/Actinomyces-23-SUMMARY/Actinomyces-23-mcl6_gene_clusters_summary.txt", sep="\t", dtype='str')

pd.set_option('display.max_columns', 7)

# subset summary table to only gene clusters identified here and columns of interest
subPan = pan[pan['gene_cluster_id'].isin(list(comparisons.keys()))]
subPan = subPan[['gene_cluster_id','Pfam','TIGRFAM','Preferred_Name']].drop_duplicates()

# add a column called treetype that describes the relationship for that gene
subPan['treetype'] = subPan['gene_cluster_id'].map(comparisons)

print(subPan)

#subPan.to_csv('~/g4/bat_tm7/Actinomyces-23-gene-tree-results.tsv', sep="\t")  # turned off here for example
gene_cluster_id Pfam \
3168 GC_00000129 MerR HTH family regulatory protein
3398 GC_00000139 Ribosomal L18 of archaea, bacteria, mitoch. an...
4111 GC_00000170 HIT domain
5721 GC_00000240 ABC transporter
7975 GC_00000338 SecA DEAD-like domain
8527 GC_00000362 Peptidase family M41
18005 GC_00000930 Haloacid dehalogenase-like hydrolase
18007 GC_00000930 Haloacid dehalogenase-like hydrolase
18811 GC_00000992 G5 domain
19344 GC_00001033 Pterin binding enzyme
19669 GC_00001058 Prephenate dehydrogenase
19678 GC_00001058 NaN
20202 GC_00001099 Cytidylate kinase
20423 GC_00001116 Aldo/keto reductase family
20436 GC_00001117 4-alpha-glucanotransferase
20644 GC_00001133 L,D-transpeptidase catalytic domain
21996 GC_00001237 NUDIX domain
TIGRFAM Preferred_Name \
3168 NaN merR2
3398 L18_bact: ribosomal protein uL18 rplR
4111 NaN hit
5721 NaN ugpC
7975 secA: preprotein translocase, SecA subunit secA
8527 FtsH_fam: ATP-dependent metallopeptidase HflB ftsH
18005 NaN yutF
18007 HAD-SF-IIA: HAD hydrolase, family IIA yutF
18811 NaN NaN
19344 DHPS: dihydropteroate synthase folP
19669 NaN tyrA
19678 NaN tyrA
20202 cmk: cytidylate kinase cmk
20423 NaN NaN
20436 malQ: 4-alpha-glucanotransferase malQ
20644 NaN enhA_2
21996 NaN mutT
treetype
3168 no_crash, resistant, most non_crashers each mo...
3398 (((noCrash) + (resistant)) + (most_crashers))
4111 no_crash, resistant, most non_crashers each mo...
5721 (((noCrash) + (resistant)) + (most_crashers))
7975 no_crash, resistant, most non_crashers each mo...
8527 no_crash, resistant, most non_crashers each mo...
18005 (noCrash) + (most_crashers)
18007 (noCrash) + (most_crashers)
18811 (noCrash) + (most_crashers)
19344 (noCrash) + (most_crashers)
19669 (noCrash) + (most_crashers)
19678 (noCrash) + (most_crashers)
20202 (noCrash) + (most_crashers)
20423 (noCrash) + (most_crashers)
20436 (noCrash) + (most_crashers)
20644 (noCrash) + (most_crashers)
21996 (noCrash) + (most_crashers)
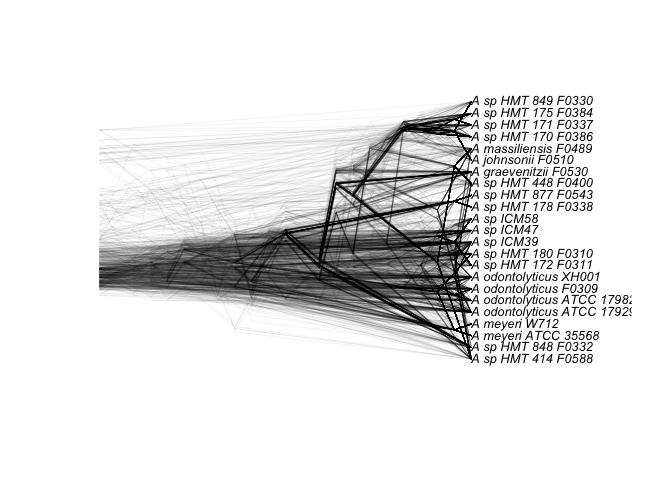
And this is the data for Figure 6b-d. To put these few genes displaying
this topology in context, the diversity of tree topologies can be
visualized with a density tree overlaying the hundreds of gene trees.
First the genes are concatenated into a multiphylo file, with the tree
name in the first column and the corresponding newick tree in the second
column:
``` bash
for file in $(ls core_gene_clusters/GC_0000*nwk); do
# get the gene cluster ID from filename
gc=$(echo $file | sed 's,^.*/,,; s,\..*$,,')
# print ID, space, newick tree for this tree
sed "s/^/$gc /" $file
done > core_gene_clusters.nwk
for file in $(ls susceptible_core_gcs/GC_0000*nwk); do
  # get the gene cluster ID from filename
  gc=$(echo $file | sed 's,^.*/,,; s,\..*$,,')
  # print ID, space, newick tree for this tree
  sed "s/^/$gc /" $file
done > susceptible_core_gcs.nwk
Then we can overlay all the newick trees for the 291 genes core to all 23 genomes:
library(ape)
library(phangorn)

allCore <- read.tree("core_gene_clusters.nwk")
densiTree(allCore, consensus = consensus(allCore), type = 'cladogram', alpha = 0.05, use.edge.length=F, scaleX = T, scale.bar = F)
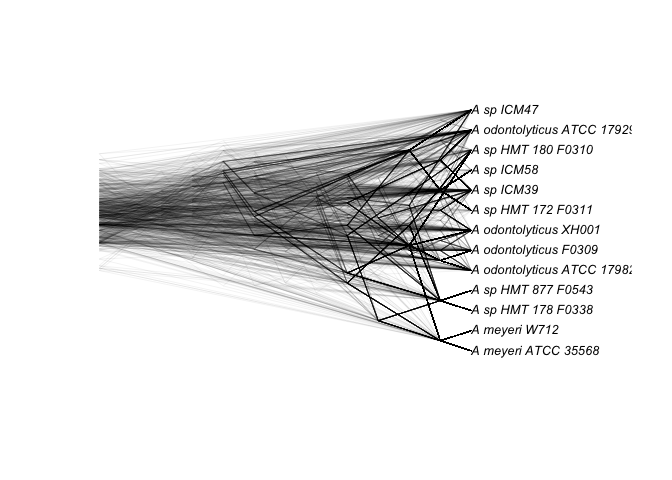
And the 419 gene clusters core to the 13 susceptible strains:
susceptibleCore <- read.tree("susceptible_core_gcs.nwk")
densiTree(susceptibleCore, consensus=consensus(susceptibleCore), type = 'cladogram', alpha = 0.05, use.edge.length=F, scaleX = T, scale.bar = F)
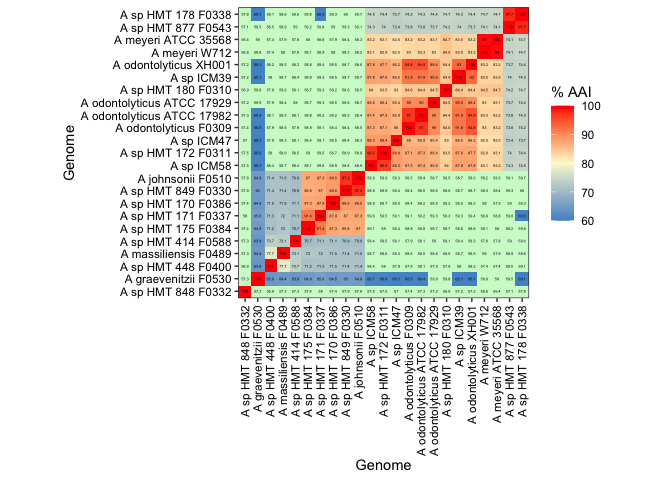
Phylogenetic analysis 1: Amino Acid Identity (AAI)
To get an idea of how different our genomes are, phylogenetically, since many represent unnamed species, we compared average amino acid identity (AAI). This metric works by calling genes with Prodigal, comparing translated AA sequences with Diamond for all gene pairs for each genome. For context, Luo et al. 2014 have a nice Figure 2 showing % AAI for genomes across various taxomonic levels. Species and genus have fairly broad AAI distributions, but all species are above 80% AAI with the majority being above 90%, while congeners are in the 50-85% range.
We used CompareM to compute
AAI using their default workflow aai_wf, which we invoked like so:
comparem aai_wf genomes genomes_aai --cpus 8 --file_ext .fasta
The key output was a file genomes_aai/aai/aai_summary.tsv that
contains the AAI information for each genome. We then modified Titus
Brown’s python
script
to parse the output into a nice table, our modified file copied here:
#! /usr/bin/env python
from __future__ import print_function, division
import sys
import numpy
import argparse

def main():
    parser = argparse.ArgumentParser()
    parser.add_argument('aai_summary_tsv')
    parser.add_argument('-o', '--output')
    args = parser.parse_args()

    assert args.output, 'please specify --output'

    indices = {}
    with open(args.aai_summary_tsv, 'rt') as fp:
        lines = fp.readlines()

    lines = [ x.strip().split('\t') for x in lines ]
    lines = lines[1:]

    # assign unique indices to the thing
    filenum = 0
    for row in lines:
        g1 = row[0]
        g2 = row[2]

        if g1 not in indices:
            indices[g1] = filenum
            filenum += 1

        if g2 not in indices:
            indices[g2] = filenum
            filenum += 1

    print('...got {} genomes.'.format(filenum))

    D = numpy.zeros((filenum, filenum))
    for row in lines:
        g1 = row[0]
        n1 = indices[g1]
        g2 = row[2]
        n2 = indices[g2]
        sim = row[5]

        D[n1,n2] = D[n2,n1] = float(sim)

    for i in range(filenum):
        D[i,i] = 100.0

    x = []
    for k, v in indices.items():
        x.append((v, k))
    x.sort()

    labeloutname = args.output + '.labels.txt'
    print('saving labels to: {}'.format(labeloutname))
    with open(labeloutname, 'w') as fp:
        fp.write("\n".join([ tup[1] for tup in x ]))

    print('saving distance matrix to: {}'.format(args.output))
    with open(args.output, 'w') as fp:
        numpy.savetxt(fp, D, header='\t'.join([z[1] for z in x]))


if __name__ == '__main__':
    main()
We called this file format_aai.py and used it like
./format_aai.py genomes_aai/aai/aai_summary.tsv -o genomes_aai/aai/aai_summary_fmt.tsv
The output was then manually formatted the last bit, producing the final
table we called Actinomyces-23-aai.tsv that we incorporated into
anvi’o, also copied here:
layers  A_ICM47 A_F0309 A_ATCC17929 A_ATCC35568 A_F0588 A_ATCC17982 A_F0489 A_F0400 A_XH001 A_F0543 A_F0337 A_F0310 A_F0332 A_F0330 A_ICM58 A_F0338 A_W712  A_ICM39 A_F0386 A_F0384 A_F0530 A_F0510 A_F0311
A_ICM47 100 85.95   85.37   82.5    58.06   85.91   58.27   57.87   86.21   73.37   59.14   83.02   57.04   58.36   88.26   73.69   82.47   86.45   58.51   58.41   60.09   58.26   88.39
A_F0309 85.95   100 89.96   83.22   57.92   97.04   58.63   57.89   94.78   73.82   59.11   84.63   57.39   58.4    87.27   74.16   82.99   91.83   58.36   58.78   60.48   58.46   87.14
A_ATCC17929 85.37   89.96   100 83.07   58.01   89.98   58.43   57.94   89.42   73.71   59.29   84.53   57.24   58.57   86.58   74.41   83.01   90.63   58.48   58.68   59.92   58.7    86.37
A_ATCC35568 82.5    83.22   83.07   100 57.81   83.25   57.85   57.43   83.21   74.12   58.78   84.74   56.44   58.35   83.16   74.73   98.98   83.53   57.86   57.96   58.98   58.26   83.07
A_F0588 58.06   57.92   58.01   57.81   100 58.06   73.14   73.67   58.27   58.99   71.12   58.09   57.31   70.91   58.42   59.64   57.78   58.42   71.14   70.7    63.88   70.91   58.45
A_ATCC17982 85.91   97.04   89.98   83.25   58.06   100 58.45   58.11   94.88   73.85   59.25   84.43   57.31   58.48   87.42   74.32   83.28   91.9    58.23   58.78   60.36   58.4    87.35
A_F0489 58.27   58.63   58.43   57.85   73.14   58.45   100 77.68   58.46   58.91   71.95   58.57   57.3    71.43   58.73   59.59   57.98   58.72   71.51   71.98   64.36   71.48   58.61
A_F0400 57.87   57.89   57.94   57.43   73.67   58.11   77.68   100 58.21   58.47   71.26   57.86   56.9    71.44   58.41   59.07   57.42   58.03   71.45   71.16   63.89   71.42   58.04
A_XH001 86.21   94.78   89.42   83.21   58.27   94.88   58.46   58.21   100 73.72   59.41   84.41   57.25   58.72   87.77   74.43   83.24   93.04   58.54   58.76   60.11   58.65   87.7
A_F0543 73.37   73.82   73.71   74.12   58.99   73.85   58.91   58.47   73.72   100 59.84   74.25   57.15   59.31   74.33   97.71   74.1    74.03   58.99   59.25   59.55   59.07   74.05
A_F0337 59.14   59.11   59.29   58.78   71.12   59.25   71.95   71.26   59.41   59.84   100 59.26   58.04   87.01   59.63   60.29   58.85   59.26   87.89   91.43   65.63   87.33   59.47
A_F0310 83.02   84.63   84.53   84.74   58.09   84.43   58.57   57.86   84.41   74.25   59.26   100 56.94   58.56   83.98   74.67   84.48   84.44   58.22   58.7    59.76   58.55   83.5
A_F0332 57.04   57.39   57.24   56.44   57.31   57.31   57.3    56.9    57.25   57.15   58.04   56.94   100 57.89   57.46   57.79   56.61   57.23   57.41   57.44   57.27   57.8    57.48
A_F0330 58.36   58.4    58.57   58.35   70.91   58.48   71.43   71.44   58.72   59.31   87.01   58.56   57.89   100 58.75   59.95   58.32   58.68   88.49   86.75   64.95   97.22   58.88
A_ICM58 88.26   87.27   86.58   83.16   58.42   87.42   58.73   58.41   87.77   74.33   59.63   83.98   57.46   58.75   100 74.52   83.12   87.8    58.88   59.12   60.71   58.92   96.47
A_F0338 73.69   74.16   74.41   74.73   59.64   74.32   59.59   59.07   74.43   97.71   60.29   74.67   57.79   59.95   74.52   100 74.7    74.31   59.33   59.79   60.09   59.67   74.4
A_W712  82.47   82.99   83.01   98.98   57.78   83.28   57.98   57.42   83.24   74.1    58.85   84.48   56.61   58.32   83.12   74.7    100 83.55   58.01   58.07   58.82   58.25   82.91
A_ICM39 86.45   91.83   90.63   83.53   58.42   91.9    58.72   58.03   93.04   74.03   59.26   84.44   57.23   58.68   87.8    74.31   83.55   100 58.45   58.81   60.1    58.7    87.6
A_F0386 58.51   58.36   58.48   57.86   71.14   58.23   71.51   71.45   58.54   58.99   87.89   58.22   57.41   88.49   58.88   59.33   58.01   58.45   100 87.33   64.49   88.47   58.68
A_F0384 58.41   58.78   58.68   57.96   70.7    58.78   71.98   71.16   58.76   59.25   91.43   58.7    57.44   86.75   59.12   59.79   58.07   58.81   87.33   100 64.93   87.01   59.02
A_F0530 60.09   60.48   59.92   58.98   63.88   60.36   64.36   63.89   60.11   59.55   65.63   59.76   57.27   64.95   60.71   60.09   58.82   60.1    64.49   64.93   100 64.86   60.56
A_F0510 58.26   58.46   58.7    58.26   70.91   58.4    71.48   71.42   58.65   59.07   87.33   58.55   57.8    97.22   58.92   59.67   58.25   58.7    88.47   87.01   64.86   100 58.88
A_F0311 88.39   87.14   86.37   83.07   58.45   87.35   58.61   58.04   87.7    74.05   59.47   83.5    57.48   58.88   96.47   74.4    82.91   87.6    58.68   59.02   60.56   58.88   100
Genome names had gotten formatted differently between the analyses, so
we made a quick matching file called matcher.txt to synchronize the
formats:
full_name   abbrev
A_odontolyticus_ATCC_17929  A_ATCC17929
A_odontolyticus_ATCC_17982  A_ATCC17982
A_meyeri_ATCC_35568 A_ATCC35568
A_odontolyticus_F0309   A_F0309
A_sp_HMT_180_F0310  A_F0310
A_sp_HMT_172_F0311  A_F0311
A_sp_HMT_849_F0330  A_F0330
A_sp_HMT_848_F0332  A_F0332
A_sp_HMT_171_F0337  A_F0337
A_sp_HMT_178_F0338  A_F0338
A_sp_HMT_175_F0384  A_F0384
A_sp_HMT_170_F0386  A_F0386
A_sp_HMT_448_F0400  A_F0400
A_massiliensis_F0489    A_F0489
A_johnsonii_F0510   A_F0510
A_graevenitzii_F0530    A_F0530
A_sp_HMT_877_F0543  A_F0543
A_sp_HMT_414_F0588  A_F0588
A_sp_ICM39  A_ICM39
A_sp_ICM47  A_ICM47
A_sp_ICM58  A_ICM58
A_meyeri_W712   A_W712
A_odontolyticus_XH001   A_XH001
We then plotted the AAI information like so:
library(ggplot2)
library(reshape2)

aai <- read.csv("Actinomyces-23-aai.tsv", sep="\t")  # matrix of aai values
matcher <- read.csv("matcher.txt", sep="\t")  # to correct as some of the genome names don't match
rownames(matcher) <- matcher$abbrev

aai$layers <- matcher[aai$layers, "full_name"]
colnames(aai)[2:ncol(aai)] <- as.character(matcher[colnames(aai)[2:ncol(aai)], "full_name"])

# this is the order from the pangenome dendrogram
panorder <- c("A_sp_HMT_178_F0338","A_sp_HMT_877_F0543","A_meyeri_ATCC_35568","A_meyeri_W712","A_odontolyticus_XH001","A_sp_ICM39","A_sp_HMT_180_F0310","A_odontolyticus_ATCC_17929","A_odontolyticus_ATCC_17982","A_odontolyticus_F0309","A_sp_ICM47","A_sp_HMT_172_F0311","A_sp_ICM58","A_johnsonii_F0510","A_sp_HMT_849_F0330","A_sp_HMT_170_F0386","A_sp_HMT_171_F0337","A_sp_HMT_175_F0384","A_sp_HMT_414_F0588","A_massiliensis_F0489","A_sp_HMT_448_F0400","A_graevenitzii_F0530","A_sp_HMT_848_F0332")

aaiLong <- melt(aai)
# order rows and columns to match the pangenome
aaiLong$layers <- factor(gsub("_", " ", aaiLong$layers), levels = gsub("_", " ", rev(panorder)))
aaiLong$variable <- factor(gsub("_", " ", aaiLong$variable), levels = gsub("_", " ", rev(panorder)))

# plot
ggplot(aaiLong, aes(x=layers,y=variable,fill=value)) +
  geom_tile(width=1.1, height=1.1) + geom_text(color='black',size=1, aes(label=round(value,1))) +
  scale_y_discrete(expand = c(0,0)) + scale_x_discrete(expand = c(0,0)) + labs(x='Genome',y='Genome',fill='% AAI') + coord_equal() +
  scale_fill_gradientn(colours = c('steelblue3','lightgoldenrodyellow', 'red'), limits=c(60,100), na.value = '#cffacf')+ theme_bw() +
  theme(axis.text = element_text(color = 'black'), axis.text.x=element_text(angle=90, hjust=1, vjust = 0.5))
Phylogenetic analysis 2: PhyloPhlAn2
For a more phylogenetic comparison of the genomes, we applied PhyloPhlAn2 to the 23 genomes. PhyloPhlAn works on a set of conserved core genes, so first we set up the database of core genes, based on Actinomyces odontolyticus which we picked as a representative since phylophlan2_setup_database prefers to work exclusively with a single species identifier:
phylophlan2_setup_database.py -g s__Actinomyces_odontolyticus -o phylophlan_Act --verbose | tee phylophlan_Act_setup.log
Once complete we ran the actual phylophlan2 analysis, which generated
the tree based on the identified concatenated core gene sequences. Of
note, we specified --min_num_entries 23 to force it to only use core
genes found in all genomes, which we deemed important as we had set up
the core database based on A. odontolyticus but we are including other
species as well. Other parameters were chosen based on the PhyloPhlAn
wiki (--diversity medium due to being a genus-level analysis and
default trimming/thresholding values)
phylophlan2.py -i genomes -o phylophlan_Act -d s__Actinomyces_odontolyticus \
--trim greedy --not_variant_threshold 0.99 --remove_fragmentary_entries \
--fragmentary_threshold 0.67 --min_num_entries 23 -t a -f isolates_config.cfg \
--diversity medium --force_nucleotides --nproc 8 --verbose | tee phylophlan_Act_output.log
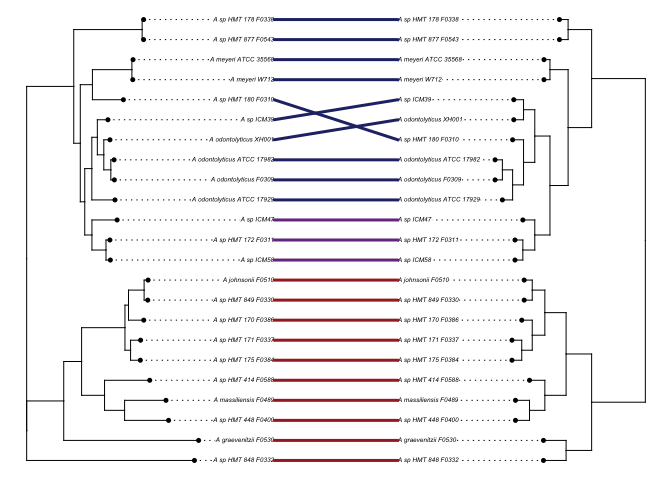
Comparing phylophlan with the pangenome dendrogram
To directly compare the agreement between the phylogenomic tree and the pangenome’s arrangement of genomes based on gene cluster content (and indirectly, the correlation between phylogeny and genome content) we plotted them against each other in R.
library(dendextend)
library(ape)
library(phytools)

panTree <- read.tree("Actinomyces-23-frequencies.nwk")  # the dendrogram from pangenome obtained with anvi-export-misc-data -t layer_orders
phlanTree <- read.tree("phylophlan_Act/RAxML_bestTree.genomes_refined.tre") # pylophlan tree

# correct the tip names
phlanTree$tip.label <- matcher[phlanTree$tip.label,1]

# root phylophlan tree roughly, to place the susceptible group sister to resistant group
phlanTree <- root(phlanTree, outgroup = panTree$tip.label[1:10], resolve.root = T)

# make a named list of colors correponding to TM7x hosting ability
colList <- setNames(c(rep('#a82828',10), rep('#77398f',3), rep('#273075',10)),panorder)

# plot it
plot.cophylo(cophylo(phlanTree, panTree, assoc = cbind(rev(panorder), rev(panorder)), rotate = T), fsize=0.4, link.col=colList, link.lty=1, link.lwd=3)
Rotating nodes to optimize matching...
Done.
And they agree exceedingly well.